gender                                                                     F
department                                                               POL
department_name                                         Department of Police
division                   MSB Information Mgmt and Tech Division Records...
assignment_category                                         Fulltime-Regular
employee_position_title                          Office Services Coordinator
date_first_hired                                                  09/22/1986
year_first_hired                                                        1986
Name: 0, dtype: object
TableReport: interactive display of a dataframe
skrub.TableReport(employees, verbose=0)
Click a table cell for more info about its column.
gender
department
department_name
division
assignment_category
employee_position_title
date_first_hired
year_first_hired
0
F
POL
Department of Police
MSB Information Mgmt and Tech Division Records Management Section
Fulltime-Regular
Office Services Coordinator
09/22/1986
1986
1
M
POL
Department of Police
ISB Major Crimes Division Fugitive Section
Fulltime-Regular
Master Police Officer
09/12/1988
1988
2
F
HHS
Department of Health and Human Services
Adult Protective and Case Management Services
Fulltime-Regular
Social Worker IV
11/19/1989
1989
3
M
COR
Correction and Rehabilitation
PRRS Facility and Security
Fulltime-Regular
Resident Supervisor II
05/05/2014
2014
4
M
HCA
Department of Housing and Community Affairs
Affordable Housing Programs
Fulltime-Regular
Planning Specialist III
03/05/2007
2007
9223
F
HHS
Department of Health and Human Services
School Based Health Centers
Fulltime-Regular
Community Health Nurse II
11/03/2015
2015
9224
F
FRS
Fire and Rescue Services
Human Resources Division
Fulltime-Regular
Fire/Rescue Division Chief
11/28/1988
1988
9225
M
HHS
Department of Health and Human Services
Child and Adolescent Mental Health Clinic Services
['Department of Police', 'Department of Health and Human Services', 'Fire and Rescue Services', 'Department of Transportation', 'Correction and Rehabilitation', 'Department of Liquor Control', 'Department of General Services', 'Department of Public Libraries', 'Department of Permitting Services', "Sheriff's Office"]
division
ObjectDType
Null values
0 (0.0%)
Unique values
694 (7.5%)
Most frequent values
School Health Services
Transit Silver Spring Ride On
Transit Gaithersburg Ride On
Highway Services
Child Welfare Services
FSB Traffic Division School Safety Section
Income Supports
PSB 3rd District Patrol
PSB 4th District Patrol
Transit Nicholson Ride On
List:
['School Health Services', 'Transit Silver Spring Ride On', 'Transit Gaithersburg Ride On', 'Highway Services', 'Child Welfare Services', 'FSB Traffic Division School Safety Section', 'Income Supports', 'PSB 3rd District Patrol', 'PSB 4th District Patrol', 'Transit Nicholson Ride On']
No columns match the selected filter: . You can change the column filter in the dropdown menu above.
Column
Column name
dtype
Null values
Unique values
Mean
Std
Min
Median
Max
0
gender
ObjectDType
17 (0.2%)
2 (< 0.1%)
1
department
ObjectDType
0 (0.0%)
37 (0.4%)
2
department_name
ObjectDType
0 (0.0%)
37 (0.4%)
3
division
ObjectDType
0 (0.0%)
694 (7.5%)
4
assignment_category
ObjectDType
0 (0.0%)
2 (< 0.1%)
5
employee_position_title
ObjectDType
0 (0.0%)
443 (4.8%)
6
date_first_hired
ObjectDType
0 (0.0%)
2264 (24.5%)
7
year_first_hired
Int64DType
0 (0.0%)
51 (0.6%)
2.00e+03
9.33
1,965
2,005
2,016
No columns match the selected filter: . You can change the column filter in the dropdown menu above.
To construct a list of column names that you can easily copy-paste
(in the box), select some columns using the checkboxes next
to the column names or the "Select all" button.
['Department of Police', 'Department of Health and Human Services', 'Fire and Rescue Services', 'Department of Transportation', 'Correction and Rehabilitation', 'Department of Liquor Control', 'Department of General Services', 'Department of Public Libraries', 'Department of Permitting Services', "Sheriff's Office"]
division
ObjectDType
Null values
0 (0.0%)
Unique values
694 (7.5%)
Most frequent values
School Health Services
Transit Silver Spring Ride On
Transit Gaithersburg Ride On
Highway Services
Child Welfare Services
FSB Traffic Division School Safety Section
Income Supports
PSB 3rd District Patrol
PSB 4th District Patrol
Transit Nicholson Ride On
List:
['School Health Services', 'Transit Silver Spring Ride On', 'Transit Gaithersburg Ride On', 'Highway Services', 'Child Welfare Services', 'FSB Traffic Division School Safety Section', 'Income Supports', 'PSB 3rd District Patrol', 'PSB 4th District Patrol', 'Transit Nicholson Ride On']
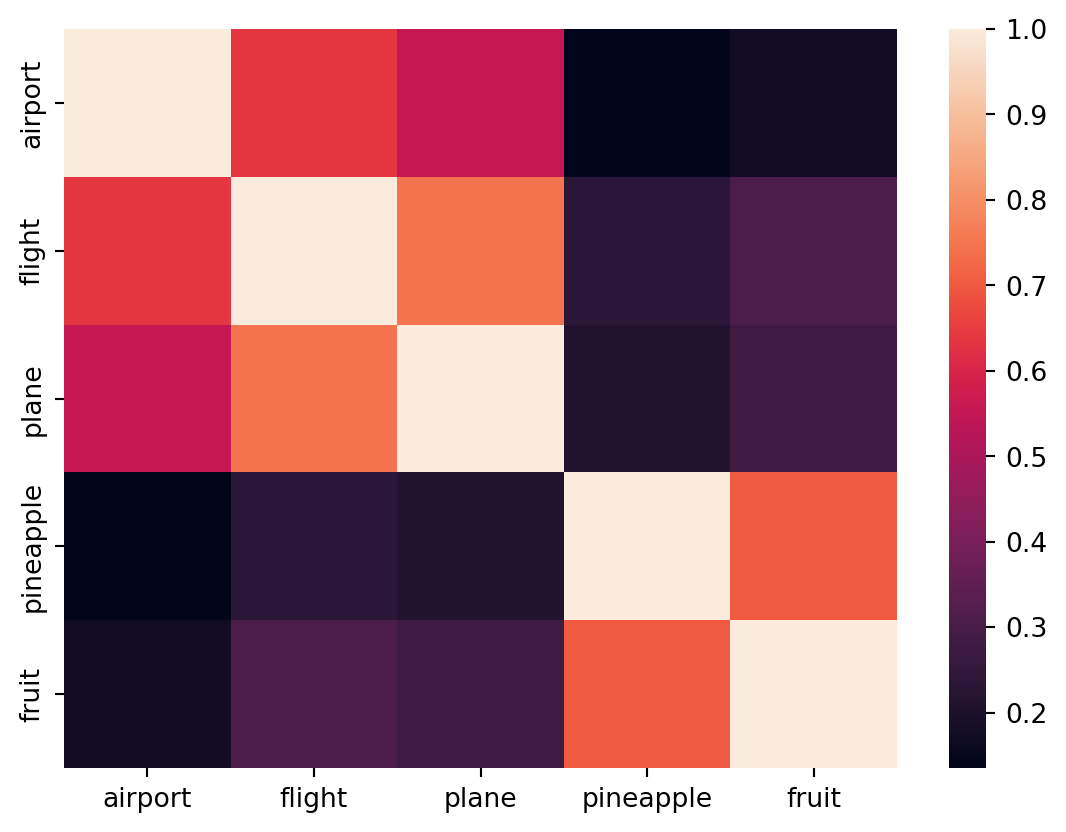
The table below shows the strength of association between the most similar columns in the dataframe.
Cramér's V statistic is a number between 0 and 1.
When it is close to 1 the columns are strongly associated — they contain similar information.
In this case, one of them may be redundant and for some models (such as linear models) it might be beneficial to remove it.
Please enable javascript
The skrub table reports need javascript to display correctly. If you are
displaying a report in a Jupyter notebook and you see this message, you may need to
re-execute the cell or to trust the notebook (button on the top right or
"File > Trust notebook").
We can tell skrub to patch the default display of polars and pandas dataframes.
In a Jupyter environment, please rerun this cell to show the HTML representation or trust the notebook. On GitHub, the HTML representation is unable to render, please try loading this page with nbviewer.org.
In a Jupyter environment, please rerun this cell to show the HTML representation or trust the notebook. On GitHub, the HTML representation is unable to render, please try loading this page with nbviewer.org.
In a Jupyter environment, please rerun this cell to show the HTML representation or trust the notebook. On GitHub, the HTML representation is unable to render, please try loading this page with nbviewer.org.
In a Jupyter environment, please rerun this cell to show the HTML representation or trust the notebook. On GitHub, the HTML representation is unable to render, please try loading this page with nbviewer.org.
In a Jupyter environment, please rerun this cell to show the HTML representation or trust the notebook. On GitHub, the HTML representation is unable to render, please try loading this page with nbviewer.org.
DatetimeEncoder()
… and those transformers turn the input into numeric features that can be used for ML
Click a table cell for more info about its column.
date_first_hired_year
date_first_hired_month
date_first_hired_day
date_first_hired_total_seconds
0
1986.0
9.0
22.0
527731200.0
1
1988.0
9.0
12.0
590025600.0
2
1989.0
11.0
19.0
627436800.0
3
2014.0
5.0
5.0
1399248000.0
4
2007.0
3.0
5.0
1173052800.0
9223
2015.0
11.0
3.0
1446508800.0
9224
1988.0
11.0
28.0
596678400.0
9225
2001.0
4.0
30.0
988588800.0
9226
2006.0
9.0
5.0
1157414400.0
9227
2012.0
1.0
30.0
1327881600.0
date_first_hired_year
Float32DType
Null values
0 (0.0%)
Unique values
51 (0.6%)
Mean ± Std
2.00e+03 ±
9.33
Median ± IQR
2.00e+03 ±
14.0
Min | Max
1.96e+03 |
2.02e+03
date_first_hired_month
Float32DType
Null values
0 (0.0%)
Unique values
12 (0.1%)
Mean ± Std
6.35 ±
3.48
Median ± IQR
7.00 ±
6.00
Min | Max
1.00 |
12.0
date_first_hired_day
Float32DType
Null values
0 (0.0%)
Unique values
31 (0.3%)
Mean ± Std
15.3 ±
8.63
Median ± IQR
16.0 ±
14.0
Min | Max
1.00 |
31.0
date_first_hired_total_seconds
Float32DType
Null values
0 (0.0%)
Unique values
2,264 (24.5%)
Mean ± Std
1.08e+09 ±
2.94e+08
Median ± IQR
1.12e+09 ±
4.41e+08
Min | Max
-1.34e+08 |
1.48e+09
No columns match the selected filter: . You can change the column filter in the dropdown menu above.
Column
Column name
dtype
Null values
Unique values
Mean
Std
Min
Median
Max
0
date_first_hired_year
Float32DType
0 (0.0%)
51 (0.6%)
2.00e+03
9.33
1.96e+03
2.00e+03
2.02e+03
1
date_first_hired_month
Float32DType
0 (0.0%)
12 (0.1%)
6.35
3.48
1.00
7.00
12.0
2
date_first_hired_day
Float32DType
0 (0.0%)
31 (0.3%)
15.3
8.63
1.00
16.0
31.0
3
date_first_hired_total_seconds
Float32DType
0 (0.0%)
2264 (24.5%)
1.08e+09
2.94e+08
-1.34e+08
1.12e+09
1.48e+09
No columns match the selected filter: . You can change the column filter in the dropdown menu above.
To construct a list of column names that you can easily copy-paste
(in the box), select some columns using the checkboxes next
to the column names or the "Select all" button.
date_first_hired_year
Float32DType
Null values
0 (0.0%)
Unique values
51 (0.6%)
Mean ± Std
2.00e+03 ±
9.33
Median ± IQR
2.00e+03 ±
14.0
Min | Max
1.96e+03 |
2.02e+03
date_first_hired_month
Float32DType
Null values
0 (0.0%)
Unique values
12 (0.1%)
Mean ± Std
6.35 ±
3.48
Median ± IQR
7.00 ±
6.00
Min | Max
1.00 |
12.0
date_first_hired_day
Float32DType
Null values
0 (0.0%)
Unique values
31 (0.3%)
Mean ± Std
15.3 ±
8.63
Median ± IQR
16.0 ±
14.0
Min | Max
1.00 |
31.0
date_first_hired_total_seconds
Float32DType
Null values
0 (0.0%)
Unique values
2,264 (24.5%)
Mean ± Std
1.08e+09 ±
2.94e+08
Median ± IQR
1.12e+09 ±
4.41e+08
Min | Max
-1.34e+08 |
1.48e+09
No columns match the selected filter: . You can change the column filter in the dropdown menu above.
The table below shows the strength of association between the most similar columns in the dataframe.
Cramér's V statistic is a number between 0 and 1.
When it is close to 1 the columns are strongly associated — they contain similar information.
In this case, one of them may be redundant and for some models (such as linear models) it might be beneficial to remove it.
Please enable javascript
The skrub table reports need javascript to display correctly. If you are
displaying a report in a Jupyter notebook and you see this message, you may need to
re-execute the cell or to trust the notebook (button on the top right or
"File > Trust notebook").
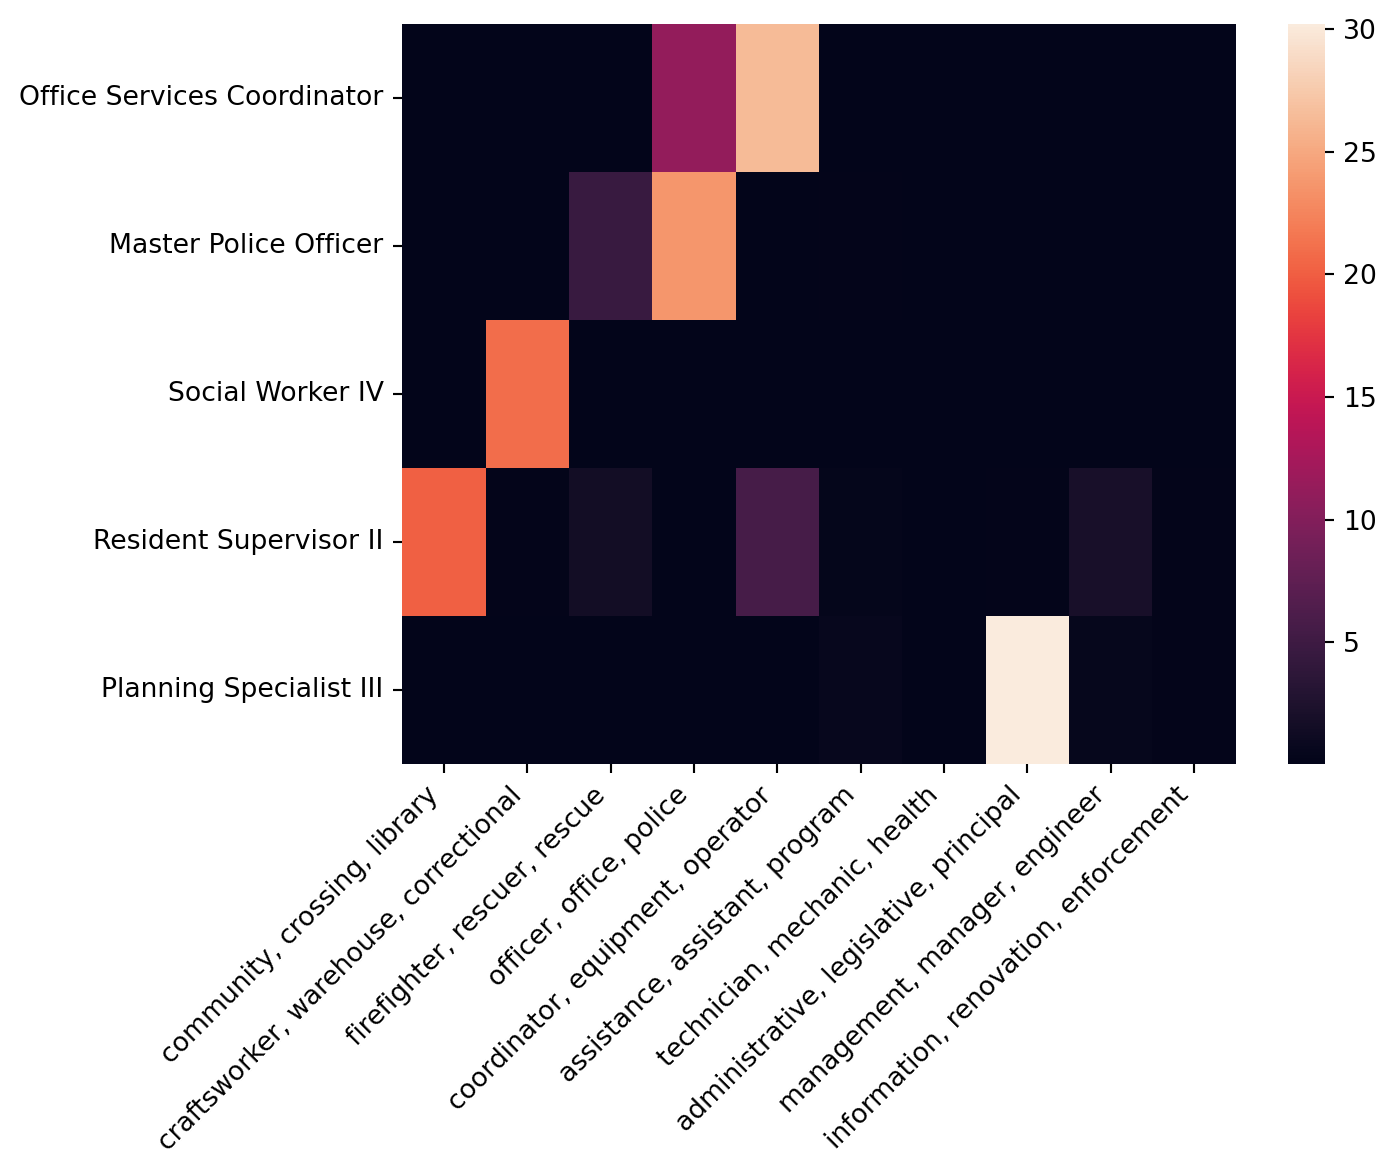
For high-cardinality categorical columns the default GapEncoder identifies sparse topics (more later).
Click a table cell for more info about its column.
employee_position_title_00
employee_position_title_01
employee_position_title_02
employee_position_title_03
employee_position_title_04
employee_position_title_05
employee_position_title_06
employee_position_title_07
employee_position_title_08
employee_position_title_09
employee_position_title_10
employee_position_title_11
employee_position_title_12
employee_position_title_13
employee_position_title_14
employee_position_title_15
employee_position_title_16
employee_position_title_17
employee_position_title_18
employee_position_title_19
employee_position_title_20
employee_position_title_21
employee_position_title_22
employee_position_title_23
employee_position_title_24
employee_position_title_25
employee_position_title_26
employee_position_title_27
employee_position_title_28
employee_position_title_29
0
0.33830252289772034
-0.12410047650337219
0.15294696390628815
-0.05557935684919357
0.08061206340789795
0.0792488381266594
0.6648700833320618
0.2597372233867645
-0.24272790551185608
-0.10827647149562836
-0.10086667537689209
-0.3539116084575653
-0.04430033266544342
-0.14628657698631287
0.17227186262607574
0.007720218971371651
-0.10003481805324554
-0.019470423460006714
0.07634616643190384
-0.09851369261741638
-0.025082774460315704
0.08304692059755325
-0.030694779008626938
-0.013212722726166248
0.017138374969363213
-0.02438262850046158
0.03788704425096512
-0.08274989575147629
-0.08013816922903061
0.030072083696722984
1
0.7206934094429016
-0.10032017529010773
-0.041333410888910294
-0.09409387409687042
-0.044986627995967865
-0.04136186093091965
-0.09167282283306122
0.00688443286344409
-0.020079102367162704
-0.04698909819126129
-0.048166826367378235
-0.007334557827562094
0.04768332839012146
-0.04986853897571564
-0.01816176436841488
-0.0025544376112520695
-0.005500881467014551
-0.0667055994272232
-0.12552222609519958
-0.017232852056622505
-0.08853733539581299
0.1442357450723648
-0.005392617080360651
-0.05871649086475372
-0.08130400627851486
0.5619822144508362
0.16698409616947174
0.06236419826745987
0.06658662110567093
0.09764270484447479
2
0.04083438590168953
0.01365299429744482
0.005985238589346409
0.0741916373372078
0.10207297652959824
0.050155140459537506
0.1809532195329666
-0.19960162043571472
0.3192621171474457
0.6230442523956299
-0.3914807438850403
0.040548115968704224
0.050999805331230164
0.025107793509960175
0.14930635690689087
0.027009394019842148
0.01099894754588604
-0.015021159313619137
-0.04676630347967148
-0.05166962742805481
-0.07397696375846863
0.024078698828816414
0.025157663971185684
0.0047105965204536915
-0.004543487448245287
0.05146479979157448
0.029231669381260872
-0.035757824778556824
-0.0010186717845499516
0.0802188366651535
3
0.03919123485684395
0.0201705452054739
0.059025660157203674
0.03311006724834442
0.0487755723297596
0.041646137833595276
0.11143435537815094
0.05276928097009659
0.01772986352443695
0.01545793004333973
0.05350314453244209
-0.014538442716002464
-0.05168895795941353
-0.006522024050354958
-0.021811168640851974
-0.016863755881786346
0.09904530644416809
0.03989032283425331
-0.07610686868429184
0.11093608289957047
0.1296788454055786
-0.010611061006784439
0.03894687443971634
0.1494467705488205
-0.0020751275587826967
0.06210887059569359
-0.19972234964370728
-0.26556089520454407
0.5036026239395142
0.009582597762346268
4
0.07684903591871262
0.02058473974466324
0.02207200974225998
0.20679962635040283
0.3316282629966736
-0.05369345843791962
-0.012092365883290768
-0.12378589063882828
-0.02875434048473835
0.03771620988845825
0.003795021679252386
-0.06844700127840042
0.015499239787459373
0.10406030714511871
-0.16212227940559387
0.053211189806461334
-0.05290457606315613
0.043189432471990585
0.061584752053022385
-0.07773629575967789
0.0370895080268383
0.03491027653217316
-0.21610653400421143
-0.03364020213484764
0.011398211121559143
-0.11730443686246872
0.1393367350101471
0.1312117725610733
0.14802083373069763
0.019435612484812737
9223
0.04252425581216812
0.00969352200627327
0.00903716403990984
0.07585039734840393
0.10413645952939987
0.44265446066856384
0.2304132580757141
0.07093005627393723
-0.16933107376098633
-0.09448327869176865
-0.005281314253807068
0.6930938959121704
0.20132911205291748
0.15864332020282745
-0.13599321246147156
-0.009549619629979134
-0.10971399396657944
0.018642297014594078
-0.0018349899910390377
-0.07242037355899811
-0.15081267058849335
-0.017257189378142357
0.08274504542350769
0.07404053211212158
0.04231170937418938
-0.007943189702928066
0.1789434403181076
-0.15124274790287018
-0.008727308362722397
-0.02868712693452835
9224
0.052944768220186234
0.1951478272676468
0.0020858608186244965
-0.026633193716406822
0.030306512489914894
-0.0024638616014271975
0.006180963478982449
0.0438024140894413
0.040131572633981705
-0.008300267159938812
0.06673958897590637
-0.00822676531970501
-0.11126301437616348
0.2147689014673233
0.1291462928056717
0.02630515955388546
-0.08429419994354248
-0.013692544773221016
-0.0015653350856155157
0.0001734015386318788
0.014601396396756172
0.00359720760025084
0.03366208076477051
0.017902366816997528
-0.020052719861268997
0.009027492254972458
-0.03239157795906067
-0.02622792311012745
0.022218424826860428
-0.016076799482107162
9225
0.006585435010492802
-4.580274617183022e-05
0.036427441984415054
0.0172380693256855
0.036491475999355316
0.0026800420600920916
0.016200734302401543
-0.005821328144520521
0.014252966269850731
0.019230756908655167
0.004922525957226753
-0.011236107908189297
0.0028990567661821842
0.004223580937832594
-0.004815510008484125
0.00031606105039827526
-0.001681739930063486
0.021476082503795624
-0.0013011633418500423
0.004404179286211729
0.016793590039014816
-0.010311059653759003
-0.01356717199087143
0.006188376806676388
0.006766617763787508
0.01743892952799797
0.0073168715462088585
-0.02006050944328308
-0.027036139741539955
0.016292722895741463
9226
0.1710350066423416
0.09533142298460007
0.02673247456550598
0.7492383122444153
-0.5193543434143066
0.09982391446828842
0.08444434404373169
-0.08392900228500366
0.0789126455783844
-0.04821457713842392
0.04623965546488762
-0.04323972016572952
-0.0770484060049057
0.02748582884669304
-0.08679363131523132
-0.02931549958884716
-0.03193484991788864
-0.031771220266819
-0.029105136170983315
-0.06655760854482651
0.04844092205166817
0.033248141407966614
-0.03553435951471329
0.021191656589508057
0.0031082017812877893
0.042252685874700546
0.06066993996500969
-0.016794690862298012
-0.01819184049963951
-0.07915330678224564
9227
0.028841139748692513
0.00896317046135664
0.024695267900824547
0.11680680513381958
0.19528168439865112
-0.016909001395106316
-0.0024943617172539234
-0.05130602419376373
-0.01261831633746624
0.02136627770960331
0.016420621424913406
-0.062297794967889786
-0.002230054931715131
0.08149279654026031
-0.10995949059724808
-0.007756456267088652
-0.015327337197959423
0.20558862388134003
-0.0251594427973032
0.015254873782396317
-0.023864256218075752
-0.04353147745132446
-0.09552563726902008
-0.008708387613296509
0.0037748408503830433
0.028391359373927116
0.028842909261584282
-0.04916607588529587
-0.044835373759269714
0.022321805357933044
employee_position_title_00
Float32DType
Null values
0 (0.0%)
Unique values
443 (4.8%)
Mean ± Std
0.196 ±
0.268
Median ± IQR
0.0755 ±
0.233
Min | Max
0.000455 |
0.945
employee_position_title_01
Float32DType
Null values
0 (0.0%)
Unique values
443 (4.8%)
Mean ± Std
0.0707 ±
0.288
Median ± IQR
0.00547 ±
0.0451
Min | Max
-0.291 |
0.926
employee_position_title_02
Float32DType
Null values
0 (0.0%)
Unique values
443 (4.8%)
Mean ± Std
0.0935 ±
0.256
Median ± IQR
0.0133 ±
0.0438
Min | Max
-0.0526 |
0.988
employee_position_title_03
Float32DType
Null values
0 (0.0%)
Unique values
443 (4.8%)
Mean ± Std
0.0915 ±
0.234
Median ± IQR
0.0286 ±
0.168
Min | Max
-0.139 |
0.837
employee_position_title_04
Float32DType
Null values
0 (0.0%)
Unique values
443 (4.8%)
Mean ± Std
0.0652 ±
0.206
Median ± IQR
0.0367 ±
0.132
Min | Max
-0.525 |
0.560
employee_position_title_05
Float32DType
Null values
0 (0.0%)
Unique values
443 (4.8%)
Mean ± Std
0.0452 ±
0.177
Median ± IQR
0.000297 ±
0.0961
Min | Max
-0.268 |
0.811
employee_position_title_06
Float32DType
Null values
0 (0.0%)
Unique values
443 (4.8%)
Mean ± Std
0.0283 ±
0.163
Median ± IQR
0.00387 ±
0.143
Min | Max
-0.275 |
0.665
employee_position_title_07
Float32DType
Null values
0 (0.0%)
Unique values
443 (4.8%)
Mean ± Std
0.0105 ±
0.162
Median ± IQR
-0.00133 ±
0.116
Min | Max
-0.465 |
0.544
employee_position_title_08
Float32DType
Null values
0 (0.0%)
Unique values
443 (4.8%)
Mean ± Std
0.0305 ±
0.151
Median ± IQR
0.00309 ±
0.115
Min | Max
-0.265 |
0.502
employee_position_title_09
Float32DType
Null values
0 (0.0%)
Unique values
443 (4.8%)
Mean ± Std
0.00804 ±
0.154
Median ± IQR
-0.00256 ±
0.0501
Min | Max
-0.528 |
0.691
employee_position_title_10
Float32DType
Null values
0 (0.0%)
Unique values
443 (4.8%)
Mean ± Std
0.0168 ±
0.149
Median ± IQR
-0.00807 ±
0.0829
Min | Max
-0.428 |
0.621
employee_position_title_11
Float32DType
Null values
0 (0.0%)
Unique values
443 (4.8%)
Mean ± Std
-0.000811 ±
0.148
Median ± IQR
0.00968 ±
0.0700
Min | Max
-0.389 |
0.693
employee_position_title_12
Float32DType
Null values
0 (0.0%)
Unique values
443 (4.8%)
Mean ± Std
-0.00310 ±
0.143
Median ± IQR
-0.00310 ±
0.0764
Min | Max
-0.283 |
0.817
employee_position_title_13
Float32DType
Null values
0 (0.0%)
Unique values
443 (4.8%)
Mean ± Std
0.0116 ±
0.140
Median ± IQR
0.00482 ±
0.105
Min | Max
-0.282 |
0.552
employee_position_title_14
Float32DType
Null values
0 (0.0%)
Unique values
443 (4.8%)
Mean ± Std
0.00128 ±
0.137
Median ± IQR
-0.0182 ±
0.165
Min | Max
-0.319 |
0.395
employee_position_title_15
Float32DType
Null values
0 (0.0%)
Unique values
443 (4.8%)
Mean ± Std
0.0162 ±
0.132
Median ± IQR
0.000302 ±
0.0397
Min | Max
-0.173 |
0.934
employee_position_title_16
Float32DType
Null values
0 (0.0%)
Unique values
443 (4.8%)
Mean ± Std
0.00958 ±
0.125
Median ± IQR
-2.32e-05 ±
0.0884
Min | Max
-0.264 |
0.714
employee_position_title_17
Float32DType
Null values
0 (0.0%)
Unique values
443 (4.8%)
Mean ± Std
0.00367 ±
0.119
Median ± IQR
-0.00135 ±
0.0661
Min | Max
-0.221 |
0.644
employee_position_title_18
Float32DType
Null values
0 (0.0%)
Unique values
443 (4.8%)
Mean ± Std
0.00444 ±
0.116
Median ± IQR
0.00145 ±
0.0674
Min | Max
-0.320 |
0.854
employee_position_title_19
Float32DType
Null values
0 (0.0%)
Unique values
443 (4.8%)
Mean ± Std
0.00883 ±
0.113
Median ± IQR
-0.00185 ±
0.0946
Min | Max
-0.292 |
0.397
employee_position_title_20
Float32DType
Null values
0 (0.0%)
Unique values
443 (4.8%)
Mean ± Std
-0.00255 ±
0.111
Median ± IQR
-0.00790 ±
0.0765
Min | Max
-0.371 |
0.413
employee_position_title_21
Float32DType
Null values
0 (0.0%)
Unique values
443 (4.8%)
Mean ± Std
0.00338 ±
0.109
Median ± IQR
-0.0120 ±
0.106
Min | Max
-0.457 |
0.470
employee_position_title_22
Float32DType
Null values
0 (0.0%)
Unique values
443 (4.8%)
Mean ± Std
0.00116 ±
0.107
Median ± IQR
-0.000636 ±
0.0749
Min | Max
-0.285 |
0.425
employee_position_title_23
Float32DType
Null values
0 (0.0%)
Unique values
443 (4.8%)
Mean ± Std
0.00662 ±
0.104
Median ± IQR
-0.00526 ±
0.0430
Min | Max
-0.279 |
0.804
employee_position_title_24
Float32DType
Null values
0 (0.0%)
Unique values
443 (4.8%)
Mean ± Std
-0.00110 ±
0.103
Median ± IQR
0.00351 ±
0.0317
Min | Max
-0.501 |
0.586
employee_position_title_25
Float32DType
Null values
0 (0.0%)
Unique values
443 (4.8%)
Mean ± Std
0.00787 ±
0.101
Median ± IQR
0.00412 ±
0.0897
Min | Max
-0.161 |
0.562
employee_position_title_26
Float32DType
Null values
0 (0.0%)
Unique values
443 (4.8%)
Mean ± Std
-0.000754 ±
0.0969
Median ± IQR
0.00128 ±
0.0740
Min | Max
-0.326 |
0.418
employee_position_title_27
Float32DType
Null values
0 (0.0%)
Unique values
443 (4.8%)
Mean ± Std
-0.00375 ±
0.0916
Median ± IQR
-0.00205 ±
0.0445
Min | Max
-0.401 |
0.351
employee_position_title_28
Float32DType
Null values
0 (0.0%)
Unique values
443 (4.8%)
Mean ± Std
0.000964 ±
0.0888
Median ± IQR
-0.00265 ±
0.0644
Min | Max
-0.249 |
0.533
employee_position_title_29
Float32DType
Null values
0 (0.0%)
Unique values
443 (4.8%)
Mean ± Std
-0.00421 ±
0.0828
Median ± IQR
0.0112 ±
0.0569
Min | Max
-0.663 |
0.151
No columns match the selected filter: . You can change the column filter in the dropdown menu above.
Column
Column name
dtype
Null values
Unique values
Mean
Std
Min
Median
Max
0
employee_position_title_00
Float32DType
0 (0.0%)
443 (4.8%)
0.196
0.268
0.000455
0.0755
0.945
1
employee_position_title_01
Float32DType
0 (0.0%)
443 (4.8%)
0.0707
0.288
-0.291
0.00547
0.926
2
employee_position_title_02
Float32DType
0 (0.0%)
443 (4.8%)
0.0935
0.256
-0.0526
0.0133
0.988
3
employee_position_title_03
Float32DType
0 (0.0%)
443 (4.8%)
0.0915
0.234
-0.139
0.0286
0.837
4
employee_position_title_04
Float32DType
0 (0.0%)
443 (4.8%)
0.0652
0.206
-0.525
0.0367
0.560
5
employee_position_title_05
Float32DType
0 (0.0%)
443 (4.8%)
0.0452
0.177
-0.268
0.000297
0.811
6
employee_position_title_06
Float32DType
0 (0.0%)
443 (4.8%)
0.0283
0.163
-0.275
0.00387
0.665
7
employee_position_title_07
Float32DType
0 (0.0%)
443 (4.8%)
0.0105
0.162
-0.465
-0.00133
0.544
8
employee_position_title_08
Float32DType
0 (0.0%)
443 (4.8%)
0.0305
0.151
-0.265
0.00309
0.502
9
employee_position_title_09
Float32DType
0 (0.0%)
443 (4.8%)
0.00804
0.154
-0.528
-0.00256
0.691
10
employee_position_title_10
Float32DType
0 (0.0%)
443 (4.8%)
0.0168
0.149
-0.428
-0.00807
0.621
11
employee_position_title_11
Float32DType
0 (0.0%)
443 (4.8%)
-0.000811
0.148
-0.389
0.00968
0.693
12
employee_position_title_12
Float32DType
0 (0.0%)
443 (4.8%)
-0.00310
0.143
-0.283
-0.00310
0.817
13
employee_position_title_13
Float32DType
0 (0.0%)
443 (4.8%)
0.0116
0.140
-0.282
0.00482
0.552
14
employee_position_title_14
Float32DType
0 (0.0%)
443 (4.8%)
0.00128
0.137
-0.319
-0.0182
0.395
15
employee_position_title_15
Float32DType
0 (0.0%)
443 (4.8%)
0.0162
0.132
-0.173
0.000302
0.934
16
employee_position_title_16
Float32DType
0 (0.0%)
443 (4.8%)
0.00958
0.125
-0.264
-2.32e-05
0.714
17
employee_position_title_17
Float32DType
0 (0.0%)
443 (4.8%)
0.00367
0.119
-0.221
-0.00135
0.644
18
employee_position_title_18
Float32DType
0 (0.0%)
443 (4.8%)
0.00444
0.116
-0.320
0.00145
0.854
19
employee_position_title_19
Float32DType
0 (0.0%)
443 (4.8%)
0.00883
0.113
-0.292
-0.00185
0.397
20
employee_position_title_20
Float32DType
0 (0.0%)
443 (4.8%)
-0.00255
0.111
-0.371
-0.00790
0.413
21
employee_position_title_21
Float32DType
0 (0.0%)
443 (4.8%)
0.00338
0.109
-0.457
-0.0120
0.470
22
employee_position_title_22
Float32DType
0 (0.0%)
443 (4.8%)
0.00116
0.107
-0.285
-0.000636
0.425
23
employee_position_title_23
Float32DType
0 (0.0%)
443 (4.8%)
0.00662
0.104
-0.279
-0.00526
0.804
24
employee_position_title_24
Float32DType
0 (0.0%)
443 (4.8%)
-0.00110
0.103
-0.501
0.00351
0.586
25
employee_position_title_25
Float32DType
0 (0.0%)
443 (4.8%)
0.00787
0.101
-0.161
0.00412
0.562
26
employee_position_title_26
Float32DType
0 (0.0%)
443 (4.8%)
-0.000754
0.0969
-0.326
0.00128
0.418
27
employee_position_title_27
Float32DType
0 (0.0%)
443 (4.8%)
-0.00375
0.0916
-0.401
-0.00205
0.351
28
employee_position_title_28
Float32DType
0 (0.0%)
443 (4.8%)
0.000964
0.0888
-0.249
-0.00265
0.533
29
employee_position_title_29
Float32DType
0 (0.0%)
443 (4.8%)
-0.00421
0.0828
-0.663
0.0112
0.151
No columns match the selected filter: . You can change the column filter in the dropdown menu above.
To construct a list of column names that you can easily copy-paste
(in the box), select some columns using the checkboxes next
to the column names or the "Select all" button.
employee_position_title_00
Float32DType
Null values
0 (0.0%)
Unique values
443 (4.8%)
Mean ± Std
0.196 ±
0.268
Median ± IQR
0.0755 ±
0.233
Min | Max
0.000455 |
0.945
employee_position_title_01
Float32DType
Null values
0 (0.0%)
Unique values
443 (4.8%)
Mean ± Std
0.0707 ±
0.288
Median ± IQR
0.00547 ±
0.0451
Min | Max
-0.291 |
0.926
employee_position_title_02
Float32DType
Null values
0 (0.0%)
Unique values
443 (4.8%)
Mean ± Std
0.0935 ±
0.256
Median ± IQR
0.0133 ±
0.0438
Min | Max
-0.0526 |
0.988
employee_position_title_03
Float32DType
Null values
0 (0.0%)
Unique values
443 (4.8%)
Mean ± Std
0.0915 ±
0.234
Median ± IQR
0.0286 ±
0.168
Min | Max
-0.139 |
0.837
employee_position_title_04
Float32DType
Null values
0 (0.0%)
Unique values
443 (4.8%)
Mean ± Std
0.0652 ±
0.206
Median ± IQR
0.0367 ±
0.132
Min | Max
-0.525 |
0.560
employee_position_title_05
Float32DType
Null values
0 (0.0%)
Unique values
443 (4.8%)
Mean ± Std
0.0452 ±
0.177
Median ± IQR
0.000297 ±
0.0961
Min | Max
-0.268 |
0.811
employee_position_title_06
Float32DType
Null values
0 (0.0%)
Unique values
443 (4.8%)
Mean ± Std
0.0283 ±
0.163
Median ± IQR
0.00387 ±
0.143
Min | Max
-0.275 |
0.665
employee_position_title_07
Float32DType
Null values
0 (0.0%)
Unique values
443 (4.8%)
Mean ± Std
0.0105 ±
0.162
Median ± IQR
-0.00133 ±
0.116
Min | Max
-0.465 |
0.544
employee_position_title_08
Float32DType
Null values
0 (0.0%)
Unique values
443 (4.8%)
Mean ± Std
0.0305 ±
0.151
Median ± IQR
0.00309 ±
0.115
Min | Max
-0.265 |
0.502
employee_position_title_09
Float32DType
Null values
0 (0.0%)
Unique values
443 (4.8%)
Mean ± Std
0.00804 ±
0.154
Median ± IQR
-0.00256 ±
0.0501
Min | Max
-0.528 |
0.691
employee_position_title_10
Float32DType
Null values
0 (0.0%)
Unique values
443 (4.8%)
Mean ± Std
0.0168 ±
0.149
Median ± IQR
-0.00807 ±
0.0829
Min | Max
-0.428 |
0.621
employee_position_title_11
Float32DType
Null values
0 (0.0%)
Unique values
443 (4.8%)
Mean ± Std
-0.000811 ±
0.148
Median ± IQR
0.00968 ±
0.0700
Min | Max
-0.389 |
0.693
employee_position_title_12
Float32DType
Null values
0 (0.0%)
Unique values
443 (4.8%)
Mean ± Std
-0.00310 ±
0.143
Median ± IQR
-0.00310 ±
0.0764
Min | Max
-0.283 |
0.817
employee_position_title_13
Float32DType
Null values
0 (0.0%)
Unique values
443 (4.8%)
Mean ± Std
0.0116 ±
0.140
Median ± IQR
0.00482 ±
0.105
Min | Max
-0.282 |
0.552
employee_position_title_14
Float32DType
Null values
0 (0.0%)
Unique values
443 (4.8%)
Mean ± Std
0.00128 ±
0.137
Median ± IQR
-0.0182 ±
0.165
Min | Max
-0.319 |
0.395
employee_position_title_15
Float32DType
Null values
0 (0.0%)
Unique values
443 (4.8%)
Mean ± Std
0.0162 ±
0.132
Median ± IQR
0.000302 ±
0.0397
Min | Max
-0.173 |
0.934
employee_position_title_16
Float32DType
Null values
0 (0.0%)
Unique values
443 (4.8%)
Mean ± Std
0.00958 ±
0.125
Median ± IQR
-2.32e-05 ±
0.0884
Min | Max
-0.264 |
0.714
employee_position_title_17
Float32DType
Null values
0 (0.0%)
Unique values
443 (4.8%)
Mean ± Std
0.00367 ±
0.119
Median ± IQR
-0.00135 ±
0.0661
Min | Max
-0.221 |
0.644
employee_position_title_18
Float32DType
Null values
0 (0.0%)
Unique values
443 (4.8%)
Mean ± Std
0.00444 ±
0.116
Median ± IQR
0.00145 ±
0.0674
Min | Max
-0.320 |
0.854
employee_position_title_19
Float32DType
Null values
0 (0.0%)
Unique values
443 (4.8%)
Mean ± Std
0.00883 ±
0.113
Median ± IQR
-0.00185 ±
0.0946
Min | Max
-0.292 |
0.397
employee_position_title_20
Float32DType
Null values
0 (0.0%)
Unique values
443 (4.8%)
Mean ± Std
-0.00255 ±
0.111
Median ± IQR
-0.00790 ±
0.0765
Min | Max
-0.371 |
0.413
employee_position_title_21
Float32DType
Null values
0 (0.0%)
Unique values
443 (4.8%)
Mean ± Std
0.00338 ±
0.109
Median ± IQR
-0.0120 ±
0.106
Min | Max
-0.457 |
0.470
employee_position_title_22
Float32DType
Null values
0 (0.0%)
Unique values
443 (4.8%)
Mean ± Std
0.00116 ±
0.107
Median ± IQR
-0.000636 ±
0.0749
Min | Max
-0.285 |
0.425
employee_position_title_23
Float32DType
Null values
0 (0.0%)
Unique values
443 (4.8%)
Mean ± Std
0.00662 ±
0.104
Median ± IQR
-0.00526 ±
0.0430
Min | Max
-0.279 |
0.804
employee_position_title_24
Float32DType
Null values
0 (0.0%)
Unique values
443 (4.8%)
Mean ± Std
-0.00110 ±
0.103
Median ± IQR
0.00351 ±
0.0317
Min | Max
-0.501 |
0.586
employee_position_title_25
Float32DType
Null values
0 (0.0%)
Unique values
443 (4.8%)
Mean ± Std
0.00787 ±
0.101
Median ± IQR
0.00412 ±
0.0897
Min | Max
-0.161 |
0.562
employee_position_title_26
Float32DType
Null values
0 (0.0%)
Unique values
443 (4.8%)
Mean ± Std
-0.000754 ±
0.0969
Median ± IQR
0.00128 ±
0.0740
Min | Max
-0.326 |
0.418
employee_position_title_27
Float32DType
Null values
0 (0.0%)
Unique values
443 (4.8%)
Mean ± Std
-0.00375 ±
0.0916
Median ± IQR
-0.00205 ±
0.0445
Min | Max
-0.401 |
0.351
employee_position_title_28
Float32DType
Null values
0 (0.0%)
Unique values
443 (4.8%)
Mean ± Std
0.000964 ±
0.0888
Median ± IQR
-0.00265 ±
0.0644
Min | Max
-0.249 |
0.533
employee_position_title_29
Float32DType
Null values
0 (0.0%)
Unique values
443 (4.8%)
Mean ± Std
-0.00421 ±
0.0828
Median ± IQR
0.0112 ±
0.0569
Min | Max
-0.663 |
0.151
No columns match the selected filter: . You can change the column filter in the dropdown menu above.
The table below shows the strength of association between the most similar columns in the dataframe.
Cramér's V statistic is a number between 0 and 1.
When it is close to 1 the columns are strongly associated — they contain similar information.
In this case, one of them may be redundant and for some models (such as linear models) it might be beneficial to remove it.
Please enable javascript
The skrub table reports need javascript to display correctly. If you are
displaying a report in a Jupyter notebook and you see this message, you may need to
re-execute the cell or to trust the notebook (button on the top right or
"File > Trust notebook").
The transformer used for each column kind can be easily configured.
Preprocessing in the TableVectorizer
The TableVectorizer actually performs a lot of preprocessing before applying the final transformers, such as:
ensuring consistent column names
detecting missing values such as "N/A"
dropping empty columns
handling pandas dtypes – float64, nan vs Float64, NA
parsing numbers
parsing dates, ensuring consistent dtype and timezone
converting numbers to float32 for faster computation & less memory downstream
A fast, stateless way of encoding strings that works especially well with models based on decision trees (gradient boosting, random forest).
4. How do I bring it all together?
Skrub has several transformers that allow peforming typical dataframe operations such as projections, joins and aggregations inside a scikit-learn pipeline.
Performing these operations in the machine-learning pipeline has several advantages:
Choices / hyperparameters can be optimized
Relevant state can be stored to ensure consistent transformations
All transformations are packaged together in an estimator
There are several transformers such as SelectCols, Joiner (fuzzy joining), InterpolationJoiner, AggJoiner, …
A toy example using the AggJoiner:
from skrub import AggJoinerairports = pd.DataFrame( {"airport_id": [1, 2],"airport_name": ["Charles de Gaulle", "Aeroporto Leonardo da Vinci"],"city": ["Paris", "Roma"], })airports
Click a table cell for more info about its column.
airport_id
airport_name
city
0
1
Charles de Gaulle
Paris
1
2
Aeroporto Leonardo da Vinci
Roma
airport_id
Int64DType
Null values
0 (0.0%)
Unique values
2 (100.0%)
Mean ± Std
1.50 ±
0.707
Median ± IQR
1 ±
1
Min | Max
1 |
2
airport_name
ObjectDType
Null values
0 (0.0%)
Unique values
2 (100.0%)
Most frequent values
Charles de Gaulle
Aeroporto Leonardo da Vinci
List:
['Charles de Gaulle', 'Aeroporto Leonardo da Vinci']
city
ObjectDType
Null values
0 (0.0%)
Unique values
2 (100.0%)
Most frequent values
Paris
Roma
List:
['Paris', 'Roma']
No columns match the selected filter: . You can change the column filter in the dropdown menu above.
Column
Column name
dtype
Null values
Unique values
Mean
Std
Min
Median
Max
0
airport_id
Int64DType
0 (0.0%)
2 (100.0%)
1.50
0.707
1
1
2
1
airport_name
ObjectDType
0 (0.0%)
2 (100.0%)
2
city
ObjectDType
0 (0.0%)
2 (100.0%)
No columns match the selected filter: . You can change the column filter in the dropdown menu above.
To construct a list of column names that you can easily copy-paste
(in the box), select some columns using the checkboxes next
to the column names or the "Select all" button.
airport_id
Int64DType
Null values
0 (0.0%)
Unique values
2 (100.0%)
Mean ± Std
1.50 ±
0.707
Median ± IQR
1 ±
1
Min | Max
1 |
2
airport_name
ObjectDType
Null values
0 (0.0%)
Unique values
2 (100.0%)
Most frequent values
Charles de Gaulle
Aeroporto Leonardo da Vinci
List:
['Charles de Gaulle', 'Aeroporto Leonardo da Vinci']
city
ObjectDType
Null values
0 (0.0%)
Unique values
2 (100.0%)
Most frequent values
Paris
Roma
List:
['Paris', 'Roma']
No columns match the selected filter: . You can change the column filter in the dropdown menu above.
The table below shows the strength of association between the most similar columns in the dataframe.
Cramér's V statistic is a number between 0 and 1.
When it is close to 1 the columns are strongly associated — they contain similar information.
In this case, one of them may be redundant and for some models (such as linear models) it might be beneficial to remove it.
Please enable javascript
The skrub table reports need javascript to display correctly. If you are
displaying a report in a Jupyter notebook and you see this message, you may need to
re-execute the cell or to trust the notebook (button on the top right or
"File > Trust notebook").
Click a table cell for more info about its column.
flight_id
from_airport
total_passengers
company
0
1
1
90
DL
1
2
1
120
AF
2
3
1
100
AF
3
4
2
70
DL
4
5
2
80
DL
5
6
2
90
TR
flight_id
Int64DType
Null values
0 (0.0%)
Unique values
6 (100.0%)
Mean ± Std
3.50 ±
1.87
Median ± IQR
3 ±
3
Min | Max
1 |
6
from_airport
Int64DType
Null values
0 (0.0%)
Unique values
2 (33.3%)
Mean ± Std
1.50 ±
0.548
Median ± IQR
1 ±
1
Min | Max
1 |
2
total_passengers
Int64DType
Null values
0 (0.0%)
Unique values
5 (83.3%)
Mean ± Std
91.7 ±
17.2
Median ± IQR
90 ±
20
Min | Max
70 |
120
company
ObjectDType
Null values
0 (0.0%)
Unique values
3 (50.0%)
Most frequent values
DL
AF
TR
List:
['DL', 'AF', 'TR']
No columns match the selected filter: . You can change the column filter in the dropdown menu above.
Column
Column name
dtype
Null values
Unique values
Mean
Std
Min
Median
Max
0
flight_id
Int64DType
0 (0.0%)
6 (100.0%)
3.50
1.87
1
3
6
1
from_airport
Int64DType
0 (0.0%)
2 (33.3%)
1.50
0.548
1
1
2
2
total_passengers
Int64DType
0 (0.0%)
5 (83.3%)
91.7
17.2
70
90
120
3
company
ObjectDType
0 (0.0%)
3 (50.0%)
No columns match the selected filter: . You can change the column filter in the dropdown menu above.
To construct a list of column names that you can easily copy-paste
(in the box), select some columns using the checkboxes next
to the column names or the "Select all" button.
flight_id
Int64DType
Null values
0 (0.0%)
Unique values
6 (100.0%)
Mean ± Std
3.50 ±
1.87
Median ± IQR
3 ±
3
Min | Max
1 |
6
from_airport
Int64DType
Null values
0 (0.0%)
Unique values
2 (33.3%)
Mean ± Std
1.50 ±
0.548
Median ± IQR
1 ±
1
Min | Max
1 |
2
total_passengers
Int64DType
Null values
0 (0.0%)
Unique values
5 (83.3%)
Mean ± Std
91.7 ±
17.2
Median ± IQR
90 ±
20
Min | Max
70 |
120
company
ObjectDType
Null values
0 (0.0%)
Unique values
3 (50.0%)
Most frequent values
DL
AF
TR
List:
['DL', 'AF', 'TR']
No columns match the selected filter: . You can change the column filter in the dropdown menu above.
The table below shows the strength of association between the most similar columns in the dataframe.
Cramér's V statistic is a number between 0 and 1.
When it is close to 1 the columns are strongly associated — they contain similar information.
In this case, one of them may be redundant and for some models (such as linear models) it might be beneficial to remove it.
Please enable javascript
The skrub table reports need javascript to display correctly. If you are
displaying a report in a Jupyter notebook and you see this message, you may need to
re-execute the cell or to trust the notebook (button on the top right or
"File > Trust notebook").
Click a table cell for more info about its column.
airport_id
airport_name
city
total_passengers_mean
total_passengers_std
0
1
Charles de Gaulle
Paris
103.33333333333333
15.275252316519467
1
2
Aeroporto Leonardo da Vinci
Roma
80.0
10.0
airport_id
Int64DType
Null values
0 (0.0%)
Unique values
2 (100.0%)
Mean ± Std
1.50 ±
0.707
Median ± IQR
1 ±
1
Min | Max
1 |
2
airport_name
ObjectDType
Null values
0 (0.0%)
Unique values
2 (100.0%)
Most frequent values
Charles de Gaulle
Aeroporto Leonardo da Vinci
List:
['Charles de Gaulle', 'Aeroporto Leonardo da Vinci']
city
ObjectDType
Null values
0 (0.0%)
Unique values
2 (100.0%)
Most frequent values
Paris
Roma
List:
['Paris', 'Roma']
total_passengers_mean
Float64DType
Null values
0 (0.0%)
Unique values
2 (100.0%)
Mean ± Std
91.7 ±
16.5
Median ± IQR
80.0 ±
23.3
Min | Max
80.0 |
103.
total_passengers_std
Float64DType
Null values
0 (0.0%)
Unique values
2 (100.0%)
Mean ± Std
12.6 ±
3.73
Median ± IQR
10.0 ±
5.28
Min | Max
10.0 |
15.3
No columns match the selected filter: . You can change the column filter in the dropdown menu above.
Column
Column name
dtype
Null values
Unique values
Mean
Std
Min
Median
Max
0
airport_id
Int64DType
0 (0.0%)
2 (100.0%)
1.50
0.707
1
1
2
1
airport_name
ObjectDType
0 (0.0%)
2 (100.0%)
2
city
ObjectDType
0 (0.0%)
2 (100.0%)
3
total_passengers_mean
Float64DType
0 (0.0%)
2 (100.0%)
91.7
16.5
80.0
80.0
103.
4
total_passengers_std
Float64DType
0 (0.0%)
2 (100.0%)
12.6
3.73
10.0
10.0
15.3
No columns match the selected filter: . You can change the column filter in the dropdown menu above.
To construct a list of column names that you can easily copy-paste
(in the box), select some columns using the checkboxes next
to the column names or the "Select all" button.
airport_id
Int64DType
Null values
0 (0.0%)
Unique values
2 (100.0%)
Mean ± Std
1.50 ±
0.707
Median ± IQR
1 ±
1
Min | Max
1 |
2
airport_name
ObjectDType
Null values
0 (0.0%)
Unique values
2 (100.0%)
Most frequent values
Charles de Gaulle
Aeroporto Leonardo da Vinci
List:
['Charles de Gaulle', 'Aeroporto Leonardo da Vinci']
city
ObjectDType
Null values
0 (0.0%)
Unique values
2 (100.0%)
Most frequent values
Paris
Roma
List:
['Paris', 'Roma']
total_passengers_mean
Float64DType
Null values
0 (0.0%)
Unique values
2 (100.0%)
Mean ± Std
91.7 ±
16.5
Median ± IQR
80.0 ±
23.3
Min | Max
80.0 |
103.
total_passengers_std
Float64DType
Null values
0 (0.0%)
Unique values
2 (100.0%)
Mean ± Std
12.6 ±
3.73
Median ± IQR
10.0 ±
5.28
Min | Max
10.0 |
15.3
No columns match the selected filter: . You can change the column filter in the dropdown menu above.
The table below shows the strength of association between the most similar columns in the dataframe.
Cramér's V statistic is a number between 0 and 1.
When it is close to 1 the columns are strongly associated — they contain similar information.
In this case, one of them may be redundant and for some models (such as linear models) it might be beneficial to remove it.
Please enable javascript
The skrub table reports need javascript to display correctly. If you are
displaying a report in a Jupyter notebook and you see this message, you may need to
re-execute the cell or to trust the notebook (button on the top right or
"File > Trust notebook").
More interactive and expressive pipelines
To go further than what can be done with scikit-learn Pipelines and the skrub transformers shown above, we are developing new utilities to easily define and inspect flexible pipelines that can process several dataframes.