Choose your columns with selectors

Introduction to Selectors

Complex column selection beyond simple name lists:

import skrub.selectors as s

Selectors are used throughout the skrub package:

  • ApplyToCols
  • TableReport filters
  • .skb.apply()

Example: Select String Columns

import pandas as pd

df = pd.DataFrame({
    "age": [25, 30, 35],
    "name": ["Alice", None, "Charlie"],
    "city": ["NYC", "LA", "Chicago"]
})

s.select() to select columns:

s.select(df, s.string())
name city
0 Alice NYC
1 None LA
2 Charlie Chicago

… and s.drop() to remove them:

s.drop(df, s.string())
age
0 25
1 30
2 35

Selecting by Data Type

  • .numeric(): Numeric columns (int or float)
  • .integer(): Integer columns only
  • .float(): Floating-point columns
  • .string(): String columns
  • .categorical(): Categorical columns
  • .any_date(): Date or datetime columns
  • .boolean(): Boolean columns

Selecting by Characteristics

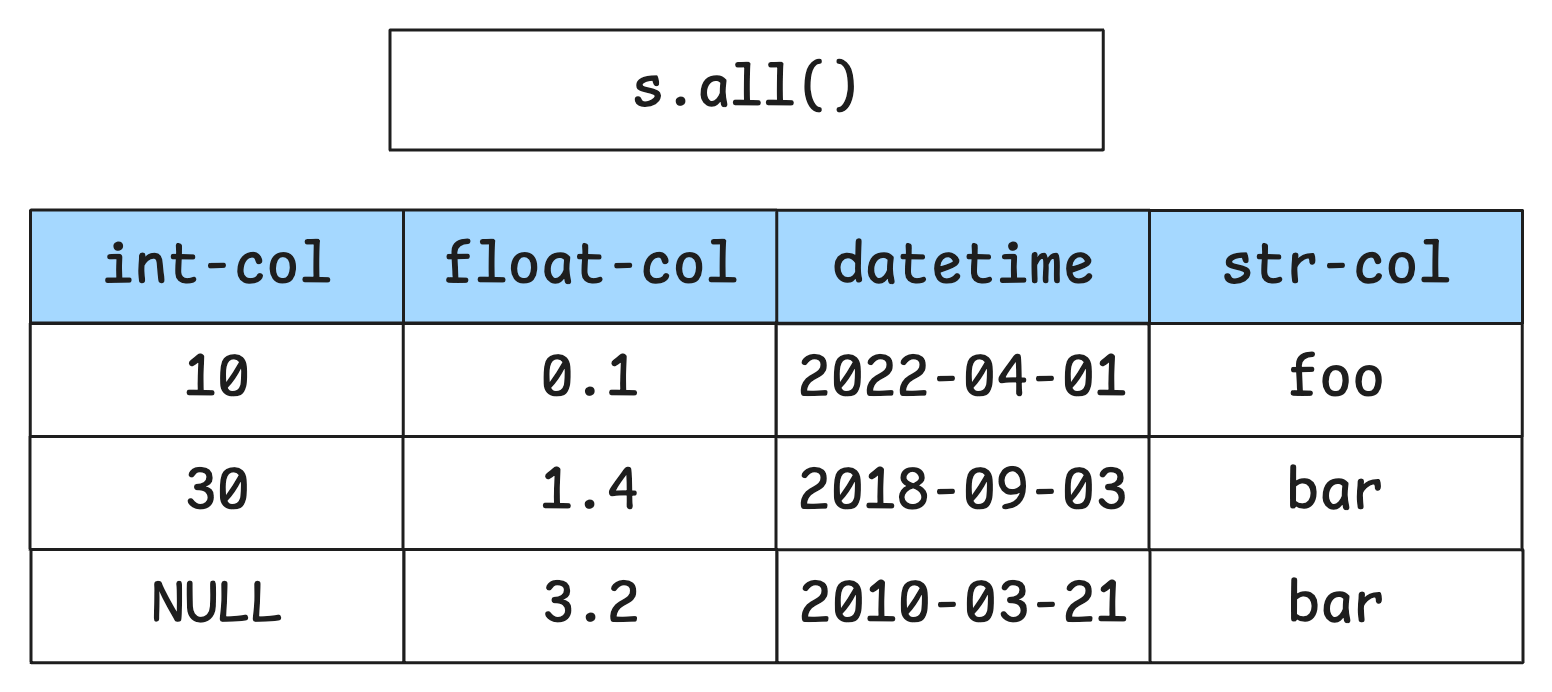
  • .all(): All columns
  • .has_nulls(): Columns with more than a given threshold of nulls (default=0)
  • .cardinality_below(threshold): fewer than threshold unique values
  • .has_dtype(): Columns that have the provided dtype

Example: select list columns with has_dtype

import polars as pl

df = pl.DataFrame({"A": [[1,2], [1,2,3]], "B": ["A", "B"]})
df.dtypes
[List(Int64), String]
sel = s.has_dtype(pl.List)
s.select(df, sel)
shape: (2, 1)
A
list[i64]
[1, 2]
[1, 2, 3]

Selecting by Name

  • .cols("name"): Specific column name(s)
  • .glob("pattern*"): Unix shell-style globbing
  • .regex("pattern"): Regular expressions
df = pd.DataFrame({
    "patient_id": [101, 102, 103],
    "metric_1": [0.3, 0.3, 0.6],
    "metric_2": [3, 5, 10],
})

s.select(df, s.glob("metric_*"))
metric_1 metric_2
0 0.3 3
1 0.3 5
2 0.6 10

Combining Selectors

Selectors can be combined:

  • each selector produces a set of columns
  • set operations (&, |, ^, -, ~) can be used to combine selectors
  • column names or lists of columns can be used directly
# Inverse: NOT numeric
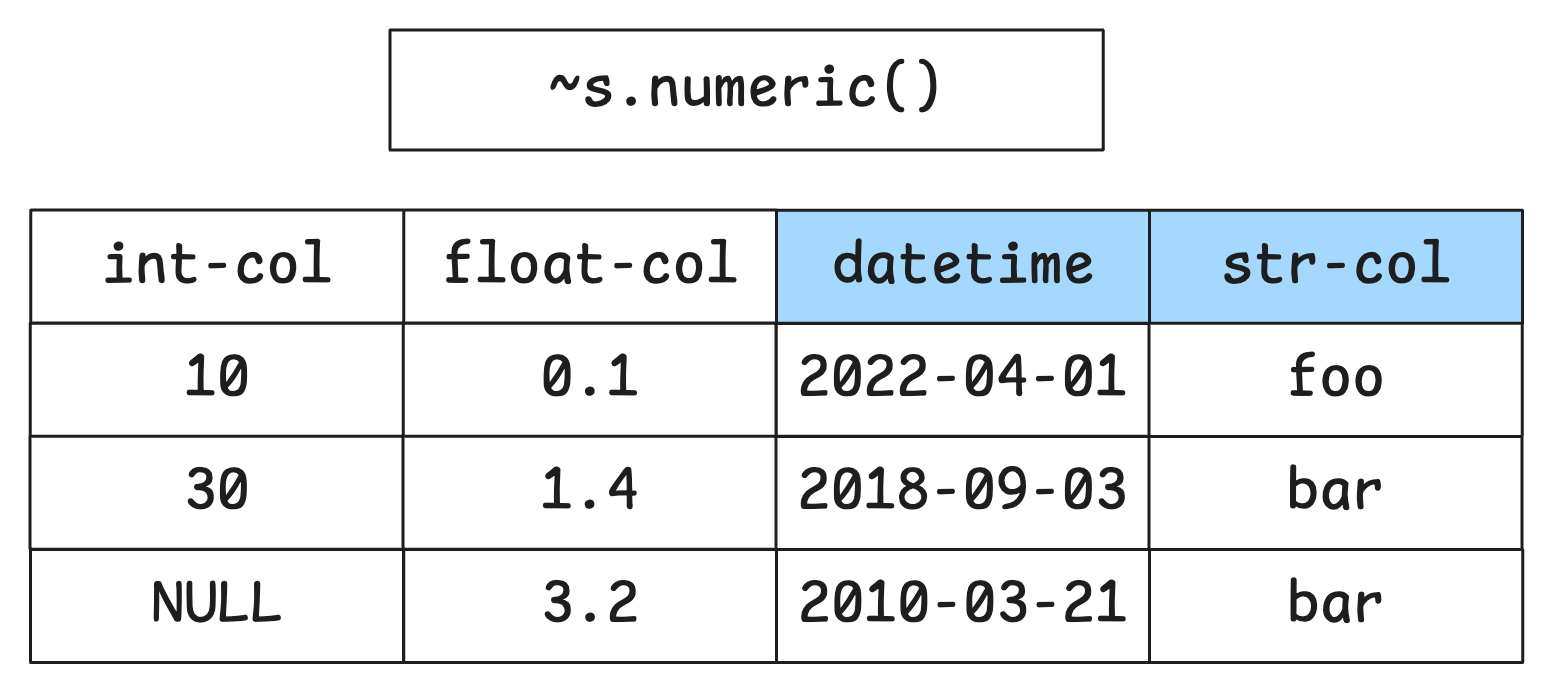
~s.numeric()

# OR: datetime columns OR string columns OR the columns in a list
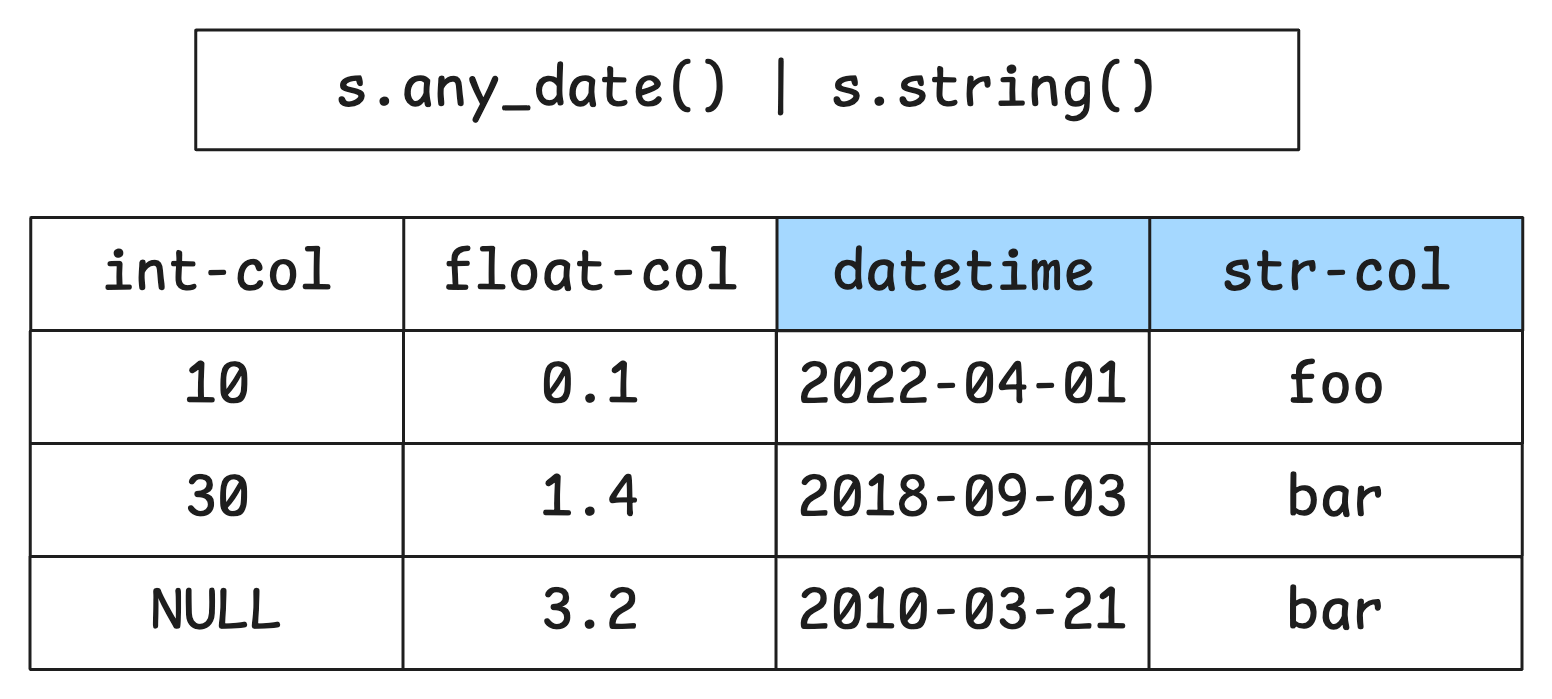
s.any_date() | s.string() | ["date", "datetime-col"]

# AND: string columns without nulls
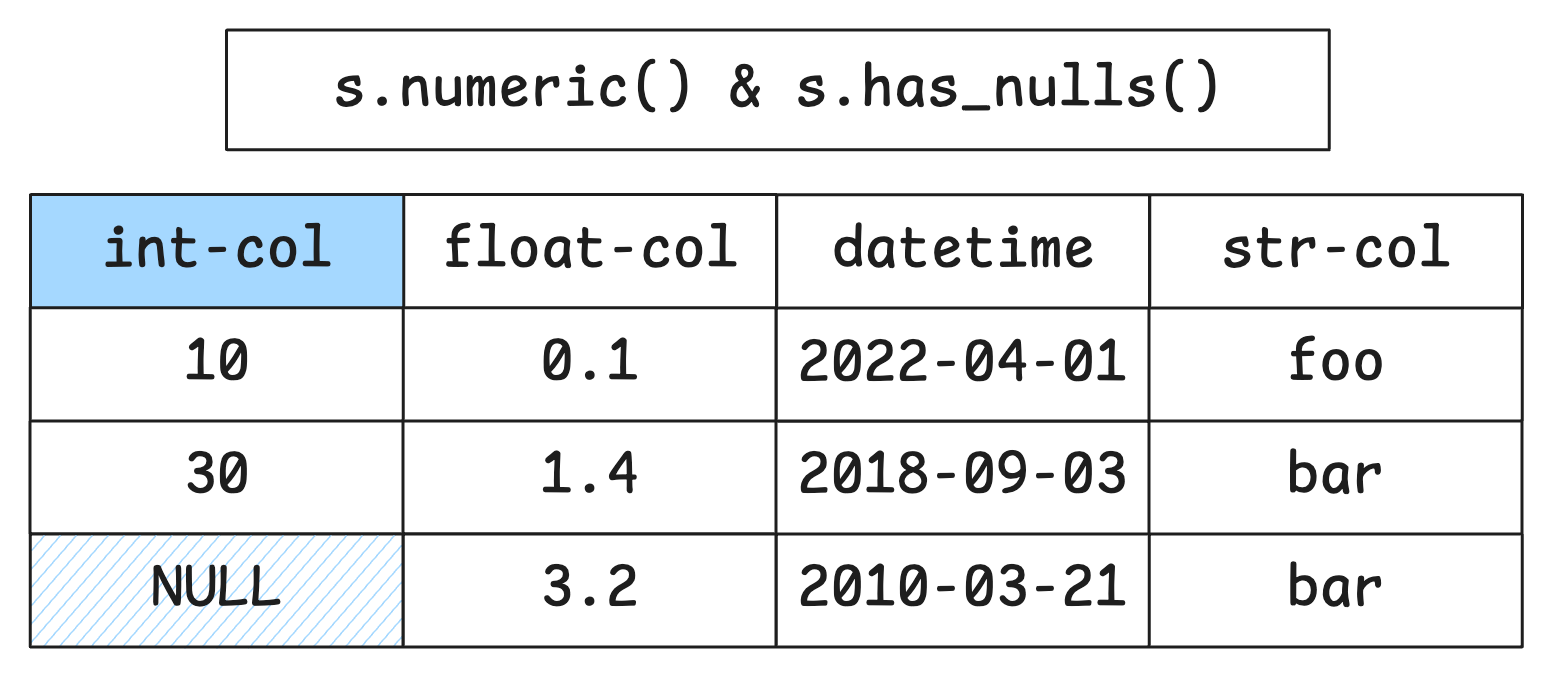
s.string() & ~s.has_nulls()

# Exclude: all columns except "datetime-col"
s.all() - "datetime-col"

Combining Selectors: .all()

Combining Selectors: NOT

Combining Selectors: AND

Combining Selectors: OR

Multiple aggregations in pandas with selectors

Define a selector: only numeric columns except the “id”

df = pd.DataFrame(
    {
        "id": [1, 2, 3, 4],
        "group": ["A", "A", "B", "B"],
        "str": ["foo", "bar", "baz", "qux"],
        "value1": [1, 2, 30, 40],
        "value2": [5, 6, 7, 8],
    }
)

# pick the numeric columns to aggregate, except the id
only_num = (s.numeric() - "id")
aggs = {col: ["mean", "sum"] for col in only_num.expand(df)}
df.groupby("group").agg(aggs)
value1 value2
mean sum mean sum
group
A 1.5 3 5.5 11
B 35.0 70 7.5 15

Using selectors to aggregate pandas dataframes

New columns are handled by the selector:

# new columns, same selector
df["value3"] = [100, 200, 300, 400]
df["note"] = ["a", "b", "c", "d"]

aggs = {col: ["mean", "sum"] for col in only_num.expand(df)}
df.groupby("group").agg(aggs)
value1 value2 value3
mean sum mean sum mean sum
group
A 1.5 3 5.5 11 150.0 300
B 35.0 70 7.5 15 350.0 700

Custom Selectors: Filter by Condition

Define a function that takes one column as input and returns True/False as output (depending on if the column is selected or not)

def more_nulls_than_half(col):
    return col.isnull().sum() / len(col) > 0.5

df = pd.DataFrame(
    {
        "no-nulls": [1, 2, 3, 4],
        "lotsa-nulls": [None, None, None, 4],
    }
)

selector = s.filter(more_nulls_than_half)
s.select(df, selector)
lotsa-nulls
0 NaN
1 NaN
2 NaN
3 4.0

Using selectors with the TableReport

The TableReport can use selectors (or simply column names) to focus only on specific columns:

from skrub import TableReport
custom_filter = {"metrics": s.glob("metric_*")}

df = pd.DataFrame({
    "patient_id": [101, 102, 103],
    "metric_1": [0.3, 0.3, 0.6],
    "metric_2": [3, 5, 10],
})

TableReport(df, column_filters=custom_filter)

Please enable javascript

The skrub table reports need javascript to display correctly. If you are displaying a report in a Jupyter notebook and you see this message, you may need to re-execute the cell or to trust the notebook (button on the top right or "File > Trust notebook").

What we have seen in this chapter

  • Selectors can be used for flexible, reusable column selection
  • Selectors can be combined with logical operators as “sets of columns”
  • expand() extracts selected column names and can be used with dataframe libraries
  • s.filter() can be used to create custom selectors for domain-specific logic
  • ApplyToCols and TableReport can use selectors to filter columns