Scaling numerical features safely
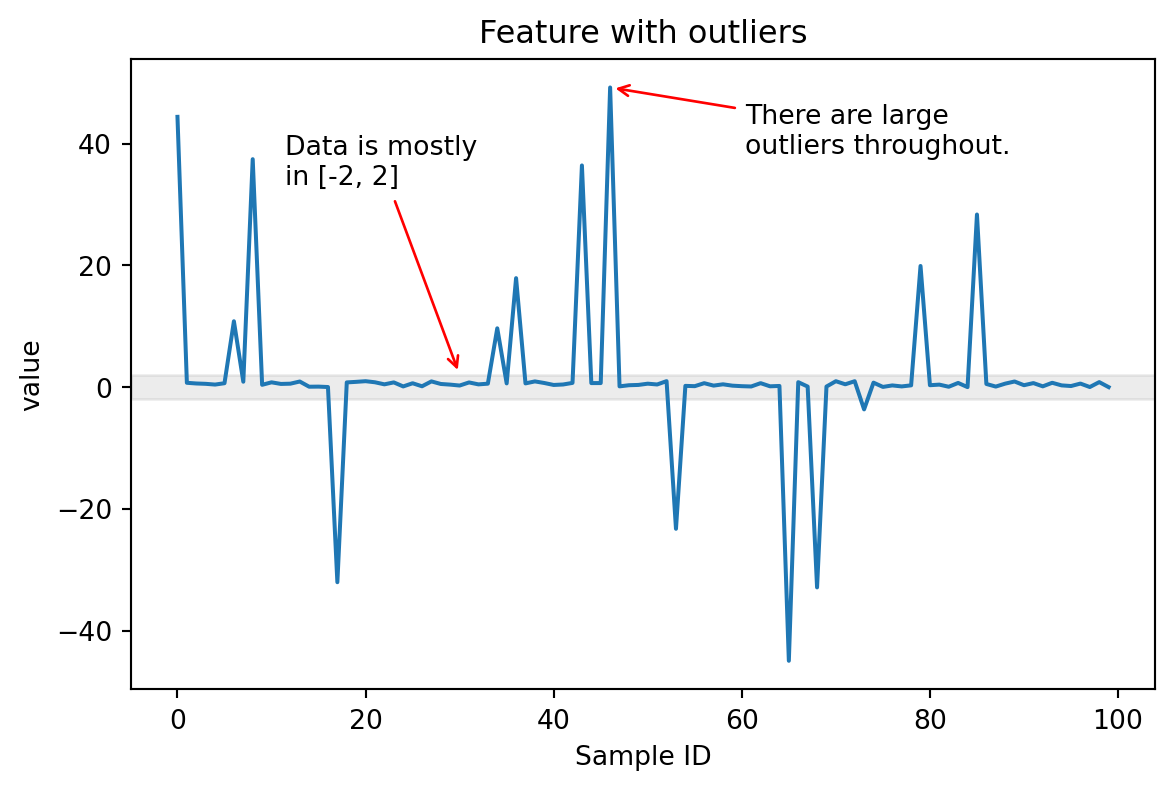
Outliers in Data
Most values in range [-2, 2], but some outliers in [-40, 40]:
StandardScaler Problems
- Uses mean and standard deviation
- Outliers make these statistics unreliable
- Scaling factor becomes too small
- Inliers get compressed into narrow range
RobustScaler
- Uses percentiles (25th, 75th) instead of mean/std
- More resistant to outliers
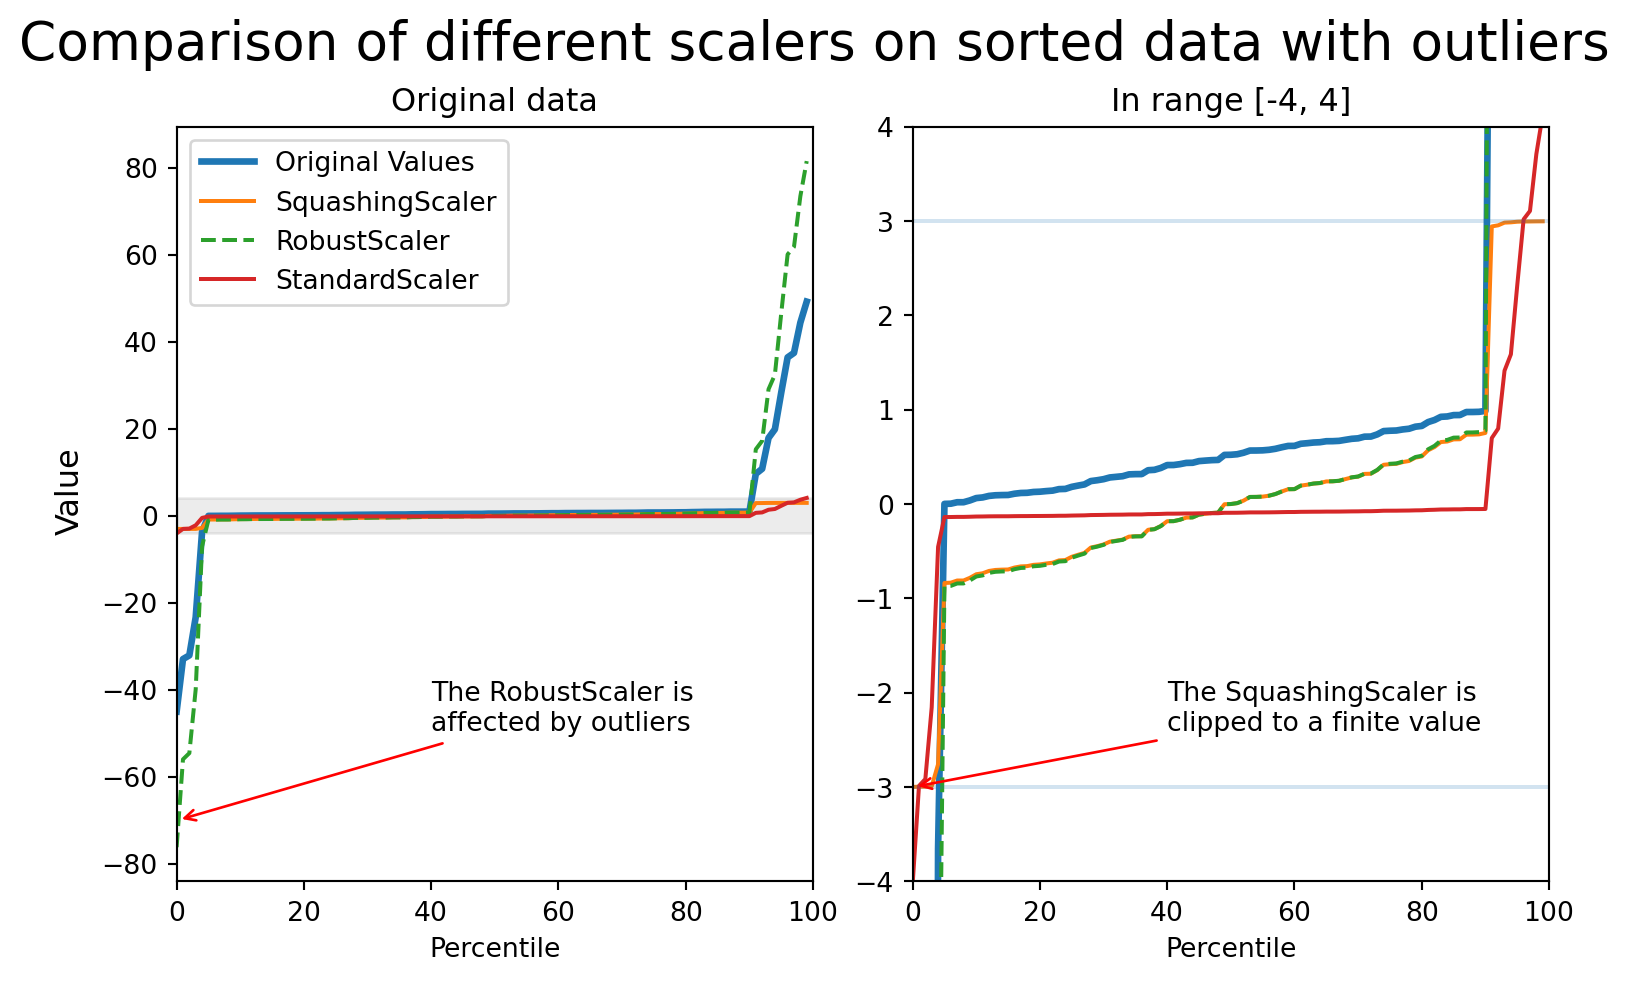
- But doesn’t bound output values
- Extreme outliers still have large scaled values
SquashingScaler: Best Approach
Smart outlier handling in skrub:
Comparing the scalers
How SquashingScaler Works
- Center the median to 0
- Use quantile-based statistics for scaling
- Fill constant columns with 0s
- Apply smooth squashing function
- Constrain output to [-3, 3] (default)
- Map infinite values to boundaries
- Keep NaN values unchanged
The Squashing Function
\[x_{\text{out}} = \frac{z}{\sqrt{1 + (z/B)^2}}\]
Where \(z\) is the centered/scaled value and \(B\) is the bound (default: 3)
Advantages
- Outlier-resistant: Inliers unaffected by outliers
- Bounded output: Predictable range ideal for neural networks
- Handles edge cases: Works with infinite values, constant columns
- Preserves NaN: Missing values stay unchanged
Disadvantages
- Non-invertible: Cannot perfectly reverse transformation
What we have seen in this chapter
StandardScaleris problematic with outliersSquashingScalersafely handles outliers- Smooth squashing preserves relative scales
- All values bounded to predictable range