| gender | department | department_name | division | assignment_category | employee_position_title | date_first_hired | year_first_hired | |
|---|---|---|---|---|---|---|---|---|
| count | 9211 | 9228 | 9228 | 9228 | 9228 | 9228 | 9228 | 9228.000000 |
| unique | 2 | 37 | 37 | 694 | 2 | 443 | 2264 | NaN |
| top | M | POL | Department of Police | School Health Services | Fulltime-Regular | Bus Operator | 12/12/2016 | NaN |
| freq | 5481 | 1844 | 1844 | 300 | 8394 | 638 | 87 | NaN |
| mean | NaN | NaN | NaN | NaN | NaN | NaN | NaN | 2003.597529 |
| std | NaN | NaN | NaN | NaN | NaN | NaN | NaN | 9.327078 |
| min | NaN | NaN | NaN | NaN | NaN | NaN | NaN | 1965.000000 |
| 25% | NaN | NaN | NaN | NaN | NaN | NaN | NaN | 1998.000000 |
| 50% | NaN | NaN | NaN | NaN | NaN | NaN | NaN | 2005.000000 |
| 75% | NaN | NaN | NaN | NaN | NaN | NaN | NaN | 2012.000000 |
| max | NaN | NaN | NaN | NaN | NaN | NaN | NaN | 2016.000000 |
Skrub workshop - Introducing Skrub
Less wrangling, more machine learning
Riccardo Cappuzzo, Jérôme Dockès, Vincent Maladiere
Inria, P16, Probabl.
2025-01-29
Plan for the presentation
- Introducing skrub
- Example use case
- Detailed explanation of the features
- Getting involved
In the beginning…
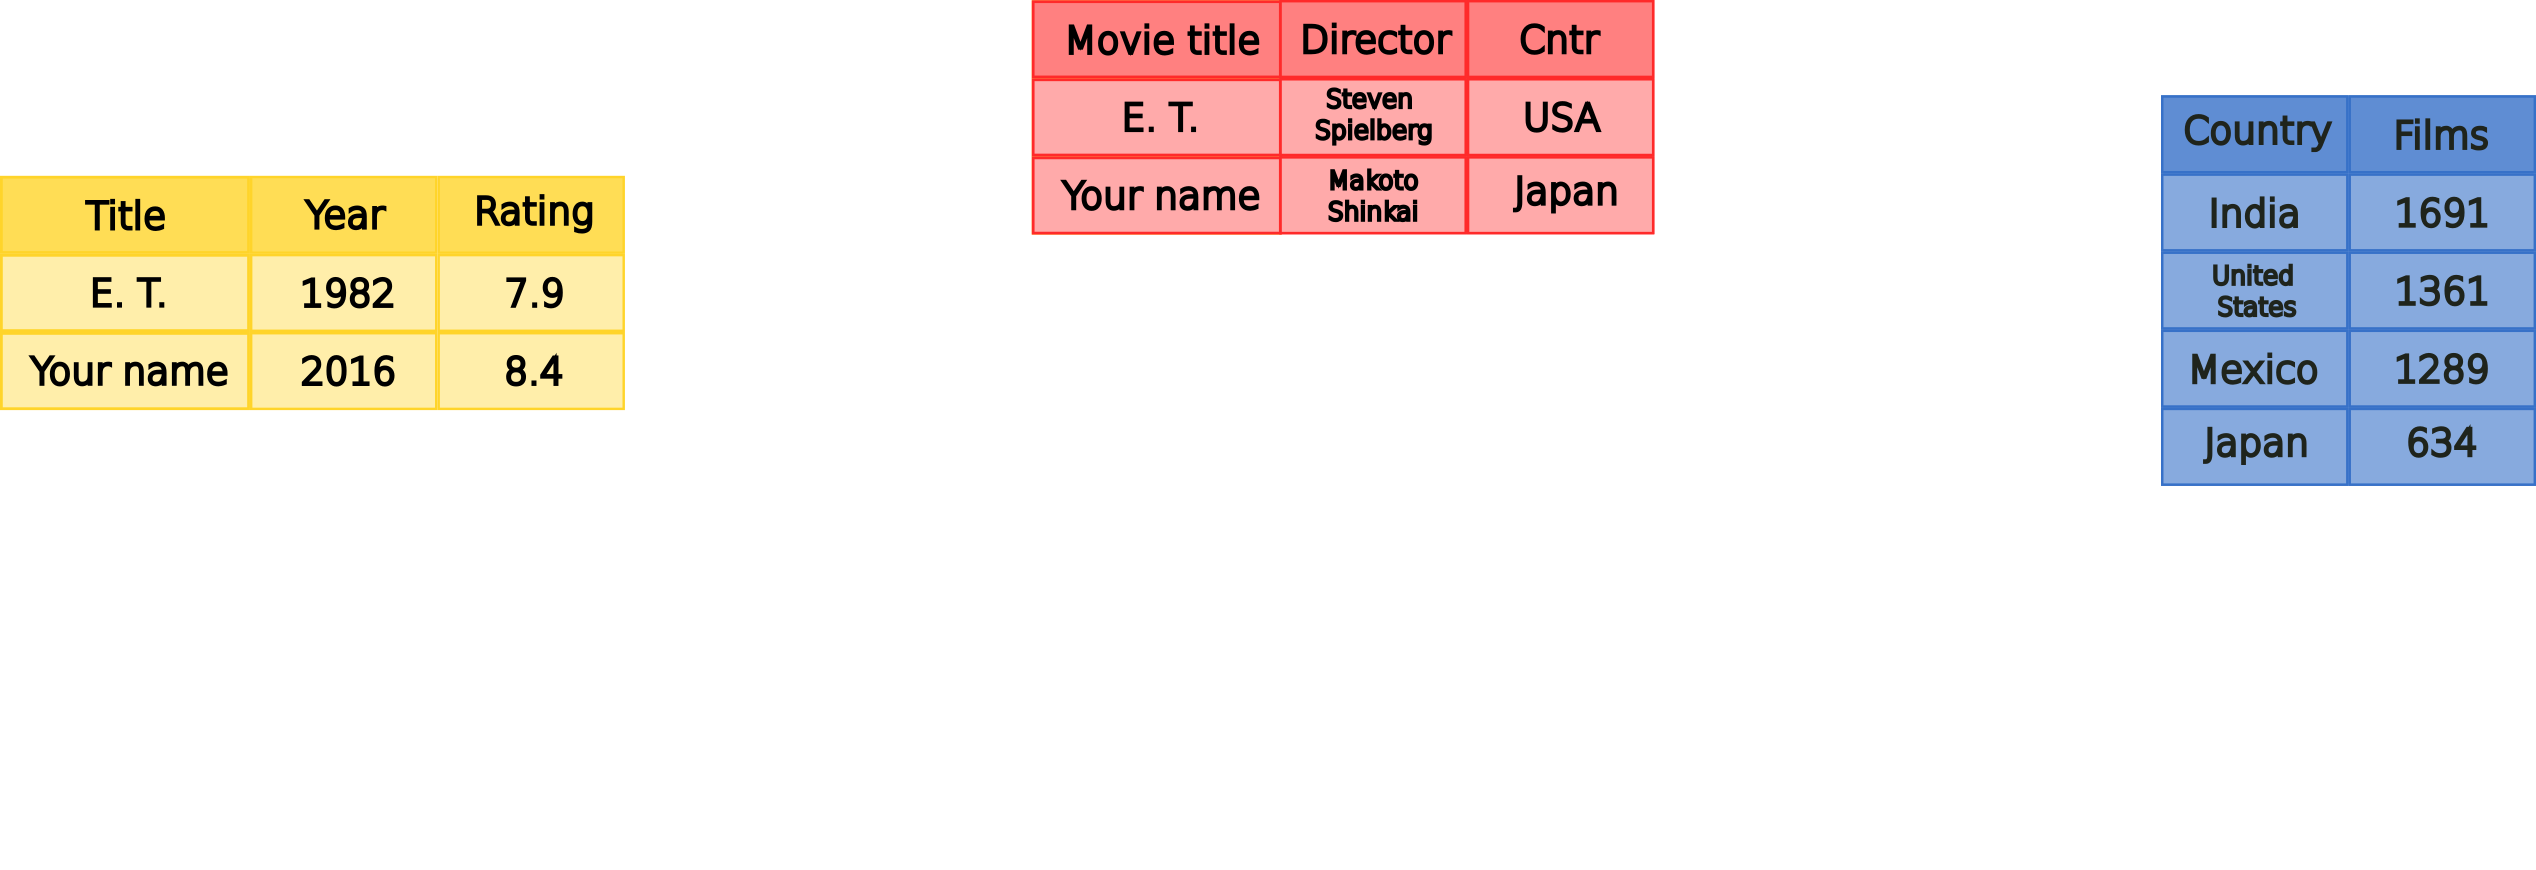
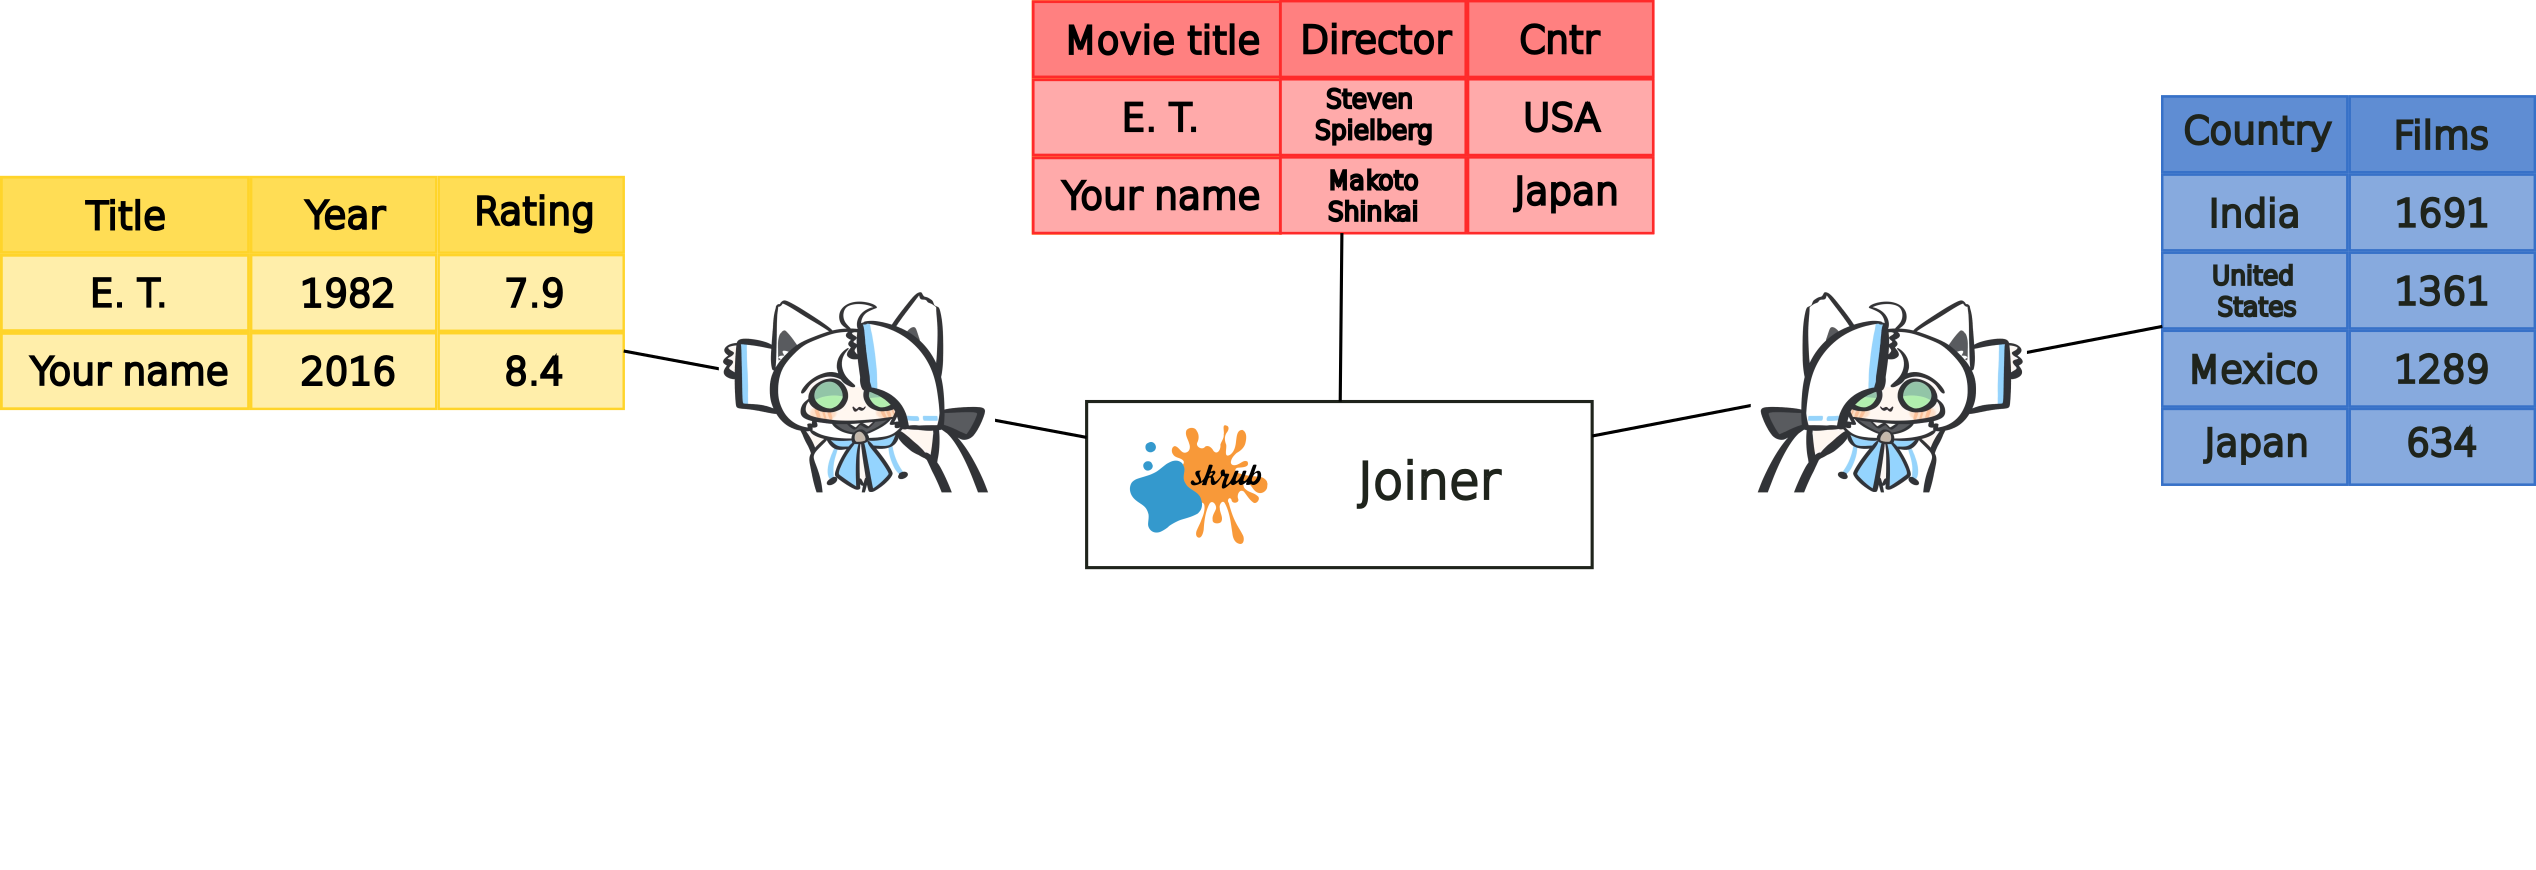
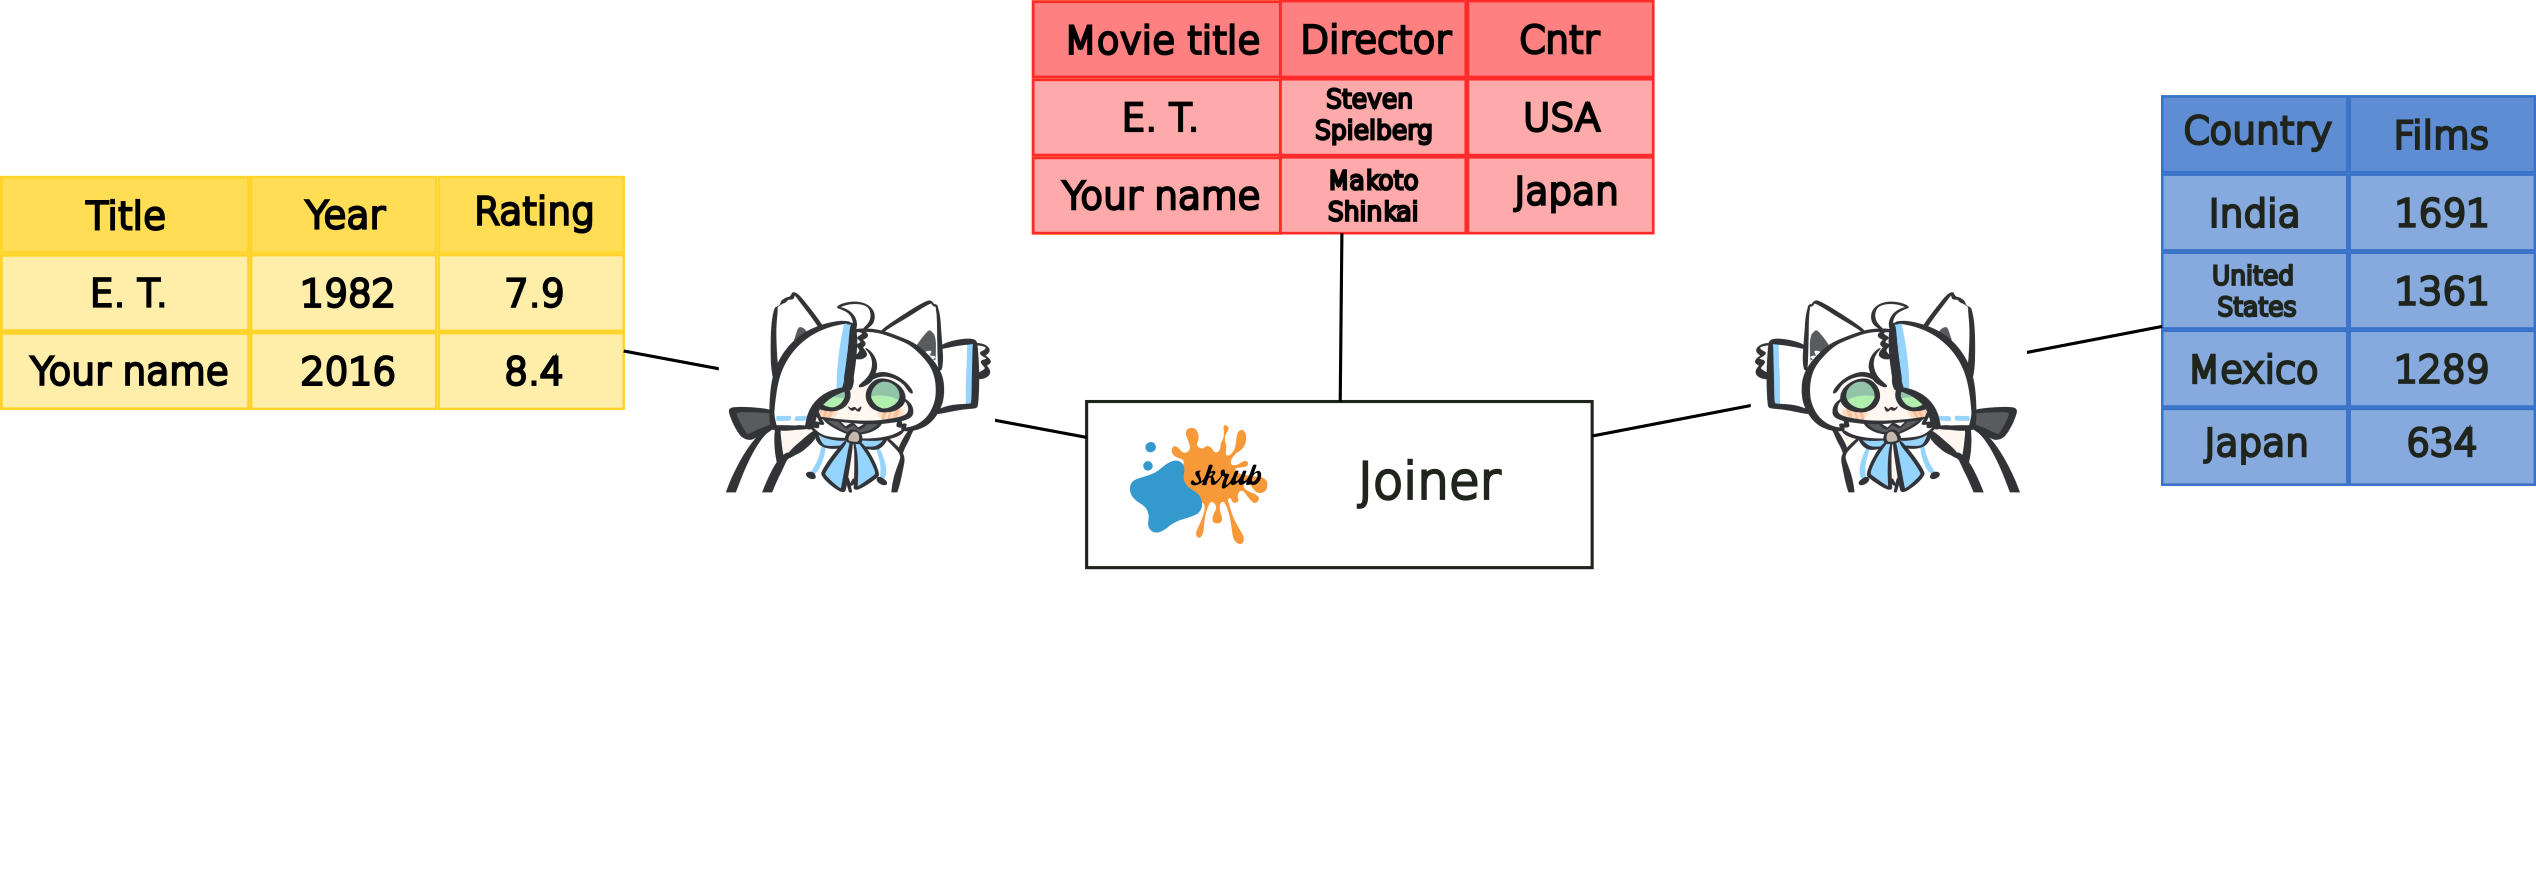
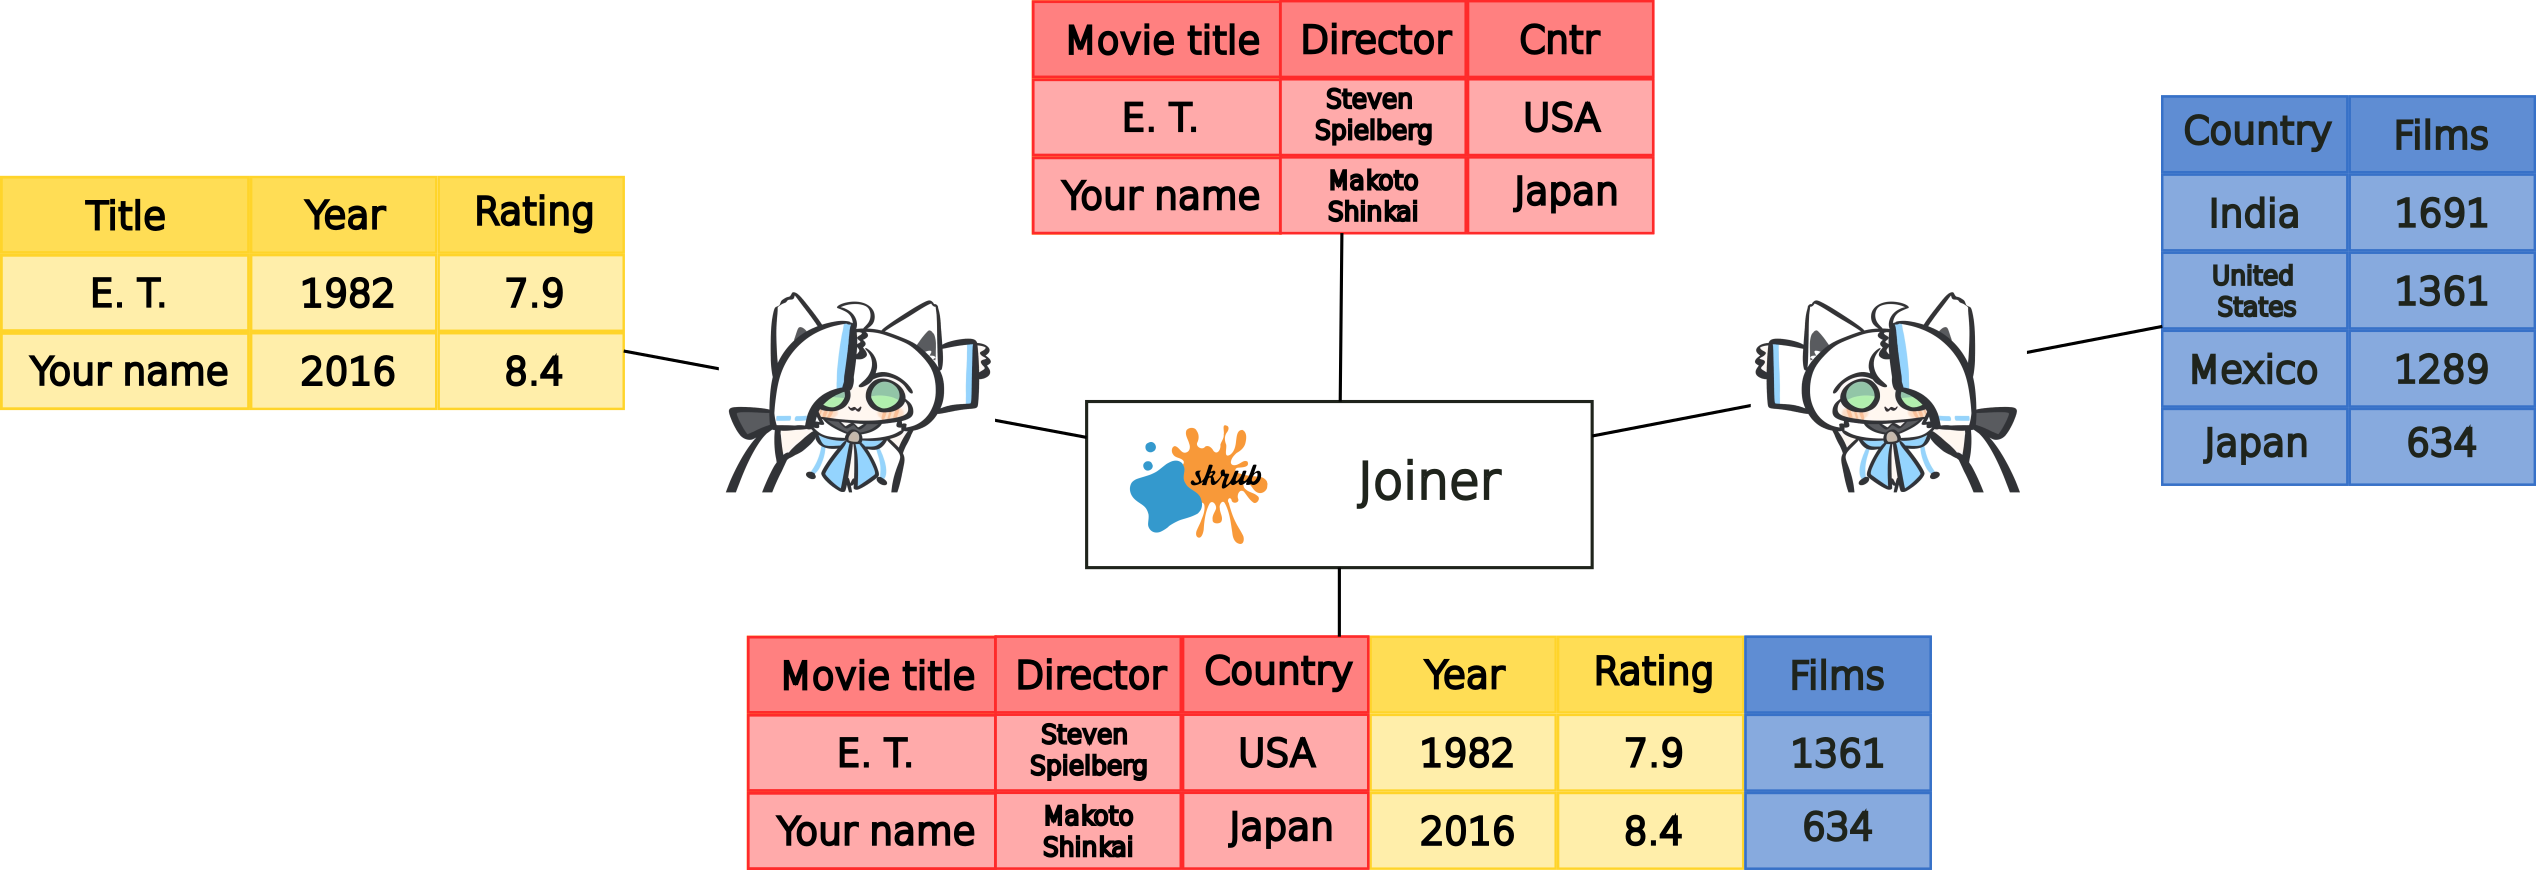
Skrub stems from the development of dirty_cat, a package that provided support for handling dirty columns and perform fuzzy joins across tables.
It has since evolved into a package that provides:
- interactive data exploration
- automated pre-processing of pandas and polars dataframes
- powerful feature engineering
Skrub’s vision
The goal of skrub is to facilitate building and deploying machine-learning models on pandas and polars dataframes (later, SQL databases…)
Skrub is high-level, with a philosophy and an API matching that of scikit-learn. It strives to bridge the worlds of databases and machine-learning, enabling imperfect assembly and representations of the data when it is noisy.
Let’s set the stage
An example use case
- Gather some data
- Employee salaries, census, customer churn…
- Explore the data
- Null values, dtypes, correlated features…
- Pre-process the data
- Build a scikit-learn estimator
- ???
- Profit 📈
Exploring the data
Exploring the data… interactively!
Main features:
- Obtain high-level statistics about the data (number of uniques, missing values…)
- Explore the distribution of values and find outliers
- Discover highly correlated columns
- Export and share the report as an
htmlfile
Build a predictive pipeline
Build a predictive pipeline
Build a predictive pipeline
Build a predictive pipeline
Build a predictive pipeline
from sklearn.linear_model import Ridge
from sklearn.pipeline import make_pipeline
from sklearn.preprocessing import StandardScaler, OneHotEncoder
from sklearn.impute import SimpleImputer
from sklearn.compose import make_column_selector as selector
from sklearn.compose import make_column_transformer

categorical_columns = selector(dtype_include=object)(employees)
numerical_columns = selector(dtype_exclude=object)(employees)

ct = make_column_transformer(
      (StandardScaler(),
       numerical_columns),
      (OneHotEncoder(handle_unknown="ignore"),
       categorical_columns))

model = make_pipeline(ct, SimpleImputer(), Ridge())
Build a predictive pipeline
Pipeline(steps=[('columntransformer',
                 ColumnTransformer(transformers=[('standardscaler',
                                                  StandardScaler(),
                                                  ['year_first_hired']),
                                                 ('onehotencoder',
                                                  OneHotEncoder(handle_unknown='ignore'),
                                                  ['gender', 'department',
                                                   'department_name',
                                                   'division',
                                                   'assignment_category',
                                                   'employee_position_title',
                                                   'date_first_hired'])])),
                ('simpleimputer', SimpleImputer()), ('ridge', Ridge())])
In a Jupyter environment, please rerun this cell to show the HTML representation or trust the notebook. On GitHub, the HTML representation is unable to render, please try loading this page with nbviewer.org.
Parameters
| steps | [('columntransformer', ...), ('simpleimputer', ...), ...] | |
| transform_input | None | |
| memory | None | |
| verbose | False |
Parameters
| transformers | [('standardscaler', ...), ('onehotencoder', ...)] | |
| remainder | 'drop' | |
| sparse_threshold | 0.3 | |
| n_jobs | None | |
| transformer_weights | None | |
| verbose | False | |
| verbose_feature_names_out | True | |
| force_int_remainder_cols | 'deprecated' |
['year_first_hired']
Parameters
| copy | True | |
| with_mean | True | |
| with_std | True |
['gender', 'department', 'department_name', 'division', 'assignment_category', 'employee_position_title', 'date_first_hired']
Parameters
| categories | 'auto' | |
| drop | None | |
| sparse_output | True | |
| dtype | <class 'numpy.float64'> | |
| handle_unknown | 'ignore' | |
| min_frequency | None | |
| max_categories | None | |
| feature_name_combiner | 'concat' |
Parameters
| missing_values | nan | |
| strategy | 'mean' | |
| fill_value | None | |
| copy | True | |
| add_indicator | False | |
| keep_empty_features | False |
Parameters
| alpha | 1.0 | |
| fit_intercept | True | |
| copy_X | True | |
| max_iter | None | |
| tol | 0.0001 | |
| solver | 'auto' | |
| positive | False | |
| random_state | None |
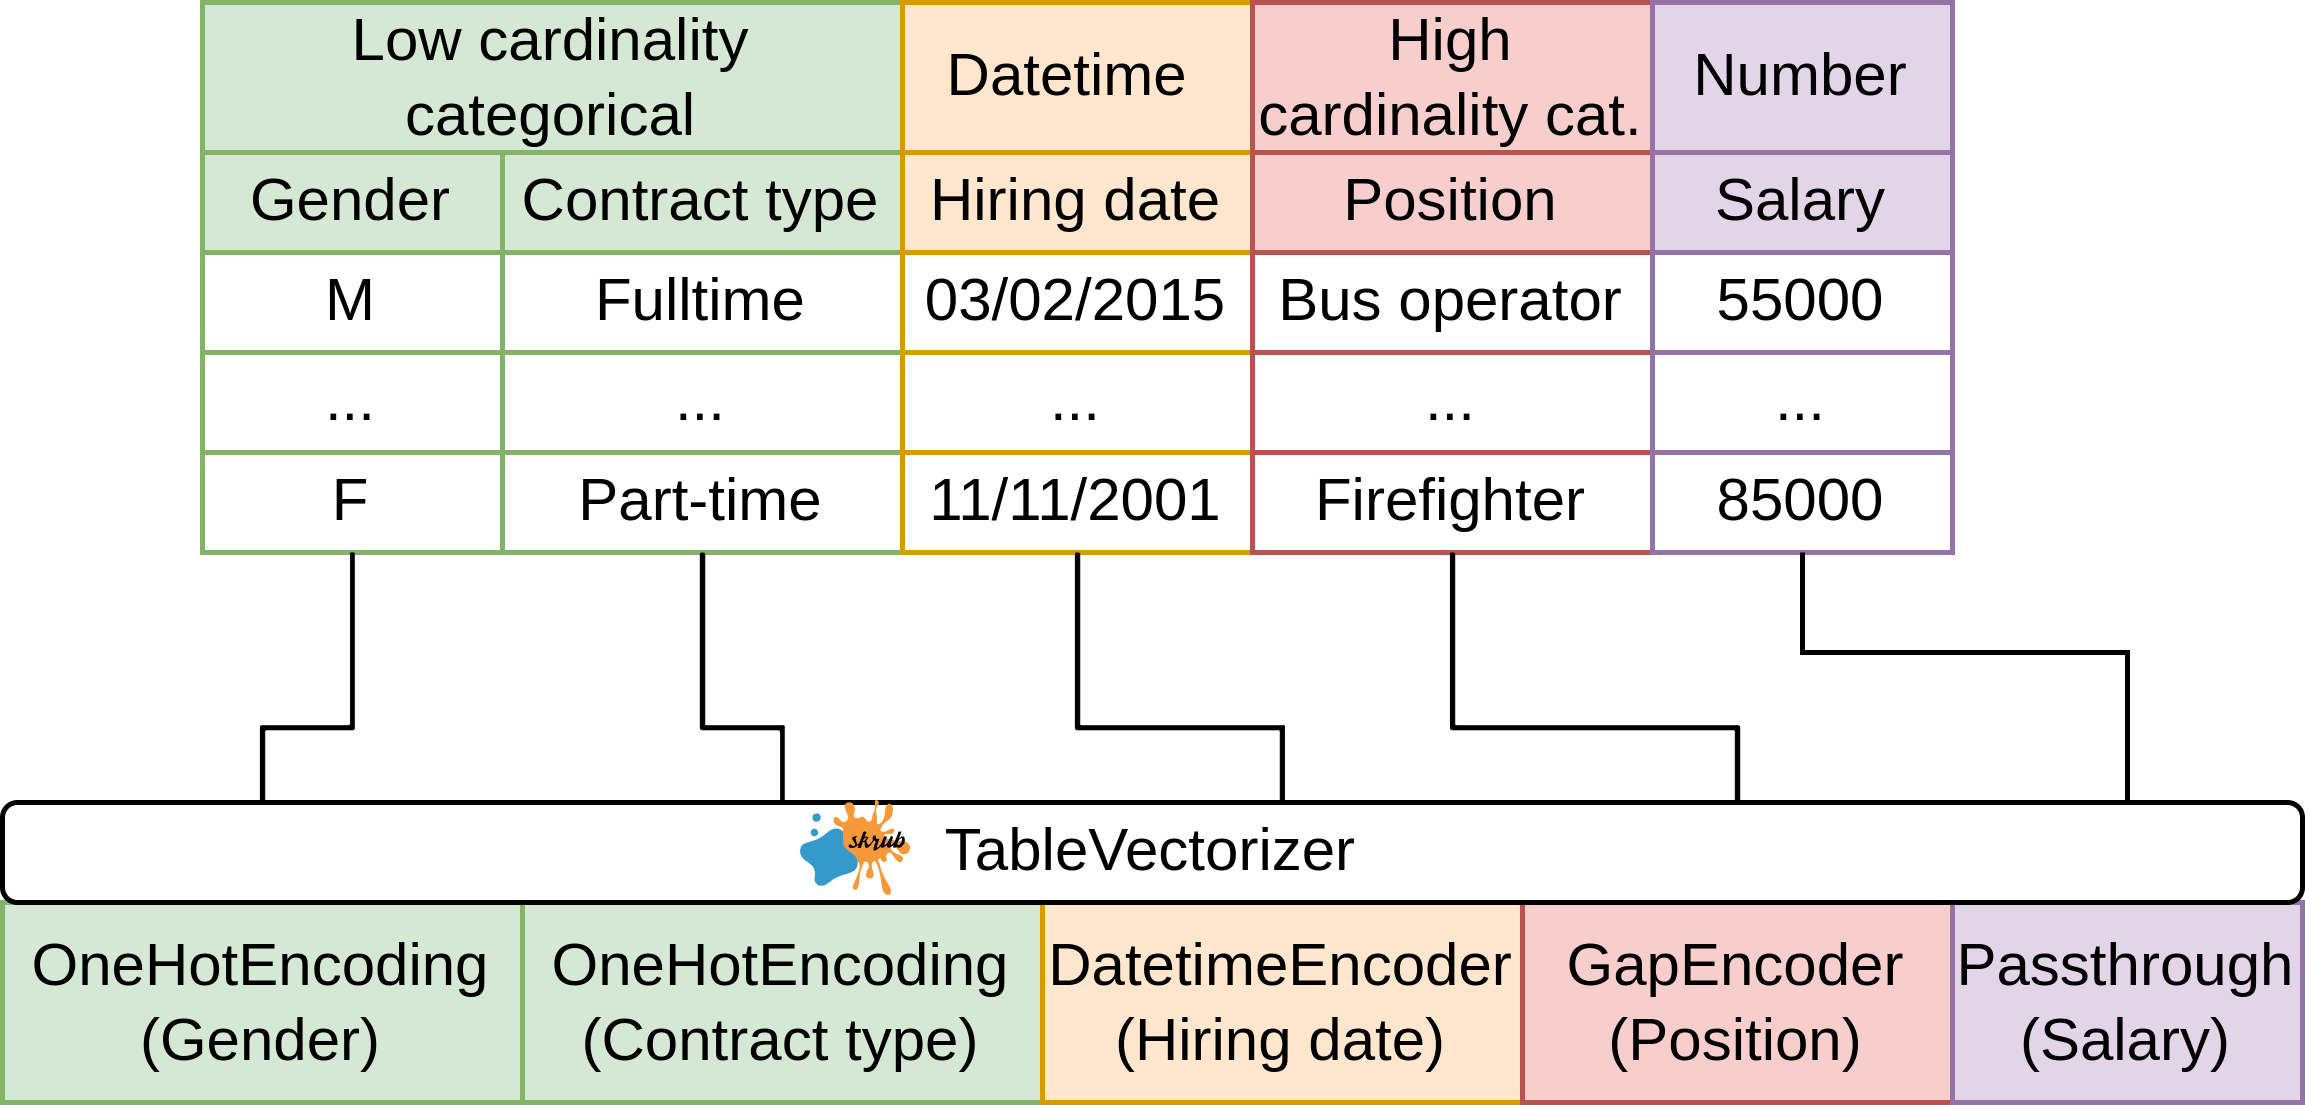
Enter: tabular_learner
Enter: tabular_learner
Pipeline(steps=[('tablevectorizer',
                 TableVectorizer(datetime=DatetimeEncoder(periodic_encoding='spline'))),
                ('simpleimputer', SimpleImputer(add_indicator=True)),
                ('standardscaler', StandardScaler()), ('ridge', Ridge())])
In a Jupyter environment, please rerun this cell to show the HTML representation or trust the notebook. On GitHub, the HTML representation is unable to render, please try loading this page with nbviewer.org.
Parameters
| steps | [('tablevectorizer', ...), ('simpleimputer', ...), ...] | |
| transform_input | None | |
| memory | None | |
| verbose | False |
Parameters
| cardinality_threshold | 40 | |
| low_cardinality | OneHotEncoder..._output=False) | |
| high_cardinality | StringEncoder() | |
| numeric | PassThrough() | |
| datetime | DatetimeEncod...ding='spline') | |
| specific_transformers | () | |
| drop_null_fraction | 1.0 | |
| drop_if_constant | False | |
| drop_if_unique | False | |
| datetime_format | None | |
| n_jobs | None |
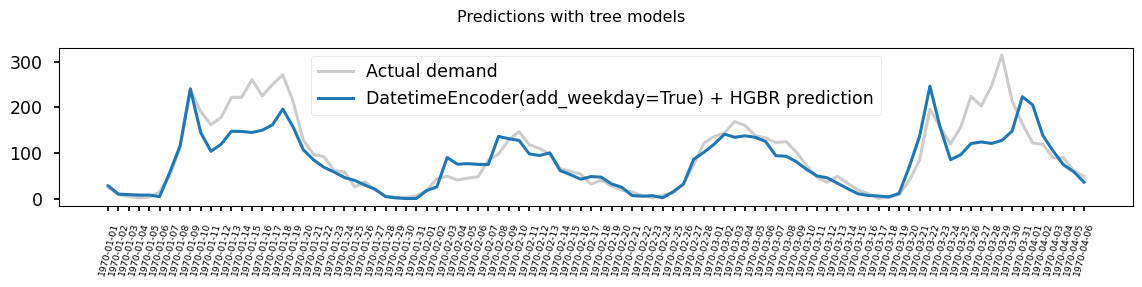
Parameters
| resolution | 'hour' | |
| add_weekday | False | |
| add_total_seconds | True | |
| add_day_of_year | False | |
| periodic_encoding | 'spline' |
Parameters
| categories | 'auto' | |
| drop | 'if_binary' | |
| sparse_output | False | |
| dtype | 'float32' | |
| handle_unknown | 'ignore' | |
| min_frequency | None | |
| max_categories | None | |
| feature_name_combiner | 'concat' |
Parameters
| n_components | 30 | |
| vectorizer | 'tfidf' | |
| ngram_range | (3, ...) | |
| analyzer | 'char_wb' | |
| stop_words | None | |
| random_state | None |
Parameters
| missing_values | nan | |
| strategy | 'mean' | |
| fill_value | None | |
| copy | True | |
| add_indicator | True | |
| keep_empty_features | False |
Parameters
| copy | True | |
| with_mean | True | |
| with_std | True |
Parameters
| alpha | 1.0 | |
| fit_intercept | True | |
| copy_X | True | |
| max_iter | None | |
| tol | 0.0001 | |
| solver | 'auto' | |
| positive | False | |
| random_state | None |