Note
Go to the end to download the full example code or to run this example in your browser via JupyterLite or Binder
Deduplicating misspelled categories#
Real world datasets often come with misspellings, for instance
in manually inputted categorical variables.
Such misspelling break data analysis steps that require
exact matching, such as a GROUP BY operation.
Merging multiple variants of the same category is known as
deduplication. It is implemented in skrub with the deduplicate() function.
Deduplication relies on unsupervised learning. It finds structures in the data without providing a-priori known and explicit labels/categories. Specifically, measuring the distance between strings can be used to find clusters of strings that are similar to each other (e.g. differ only by a misspelling) and hence, flag and regroup potentially misspelled category names in an unsupervised manner.
A typical use case#
Let’s take an example: as a data scientist, your job is to analyze the data from a hospital ward. In the data, we notice that in most cases, the doctor prescribes one of three following medications: “Contrivan”, “Genericon” or “Zipholan”.
However, data entry is manual and - either because the doctor’s handwriting was hard to decipher, or due to mistakes during input - there are multiple spelling mistakes in the dataset.
Let’s generate this example dataset:
import pandas as pd
import numpy as np
from skrub.datasets import make_deduplication_data

duplicated_names = make_deduplication_data(
    examples=["Contrivan", "Genericon", "Zipholan"],  # our three medication names
    entries_per_example=[500, 100, 1500],  # their respective number of occurrences
    prob_mistake_per_letter=0.05,  # 5% probability of typo per letter
    random_state=42,  # set seed for reproducibility
)

duplicated_names[:5]
['Contrivan', 'Cvntrivan', 'Contrivan', 'Coqtrivan', 'Contriian']
We then extract the unique medication names in the data and visualize how often they appear:
import matplotlib.pyplot as plt

unique_examples, counts = np.unique(duplicated_names, return_counts=True)

plt.figure(figsize=(10, 15))
plt.barh(unique_examples, counts)
plt.ylabel("Medication name")
plt.xlabel("Count")
plt.show()
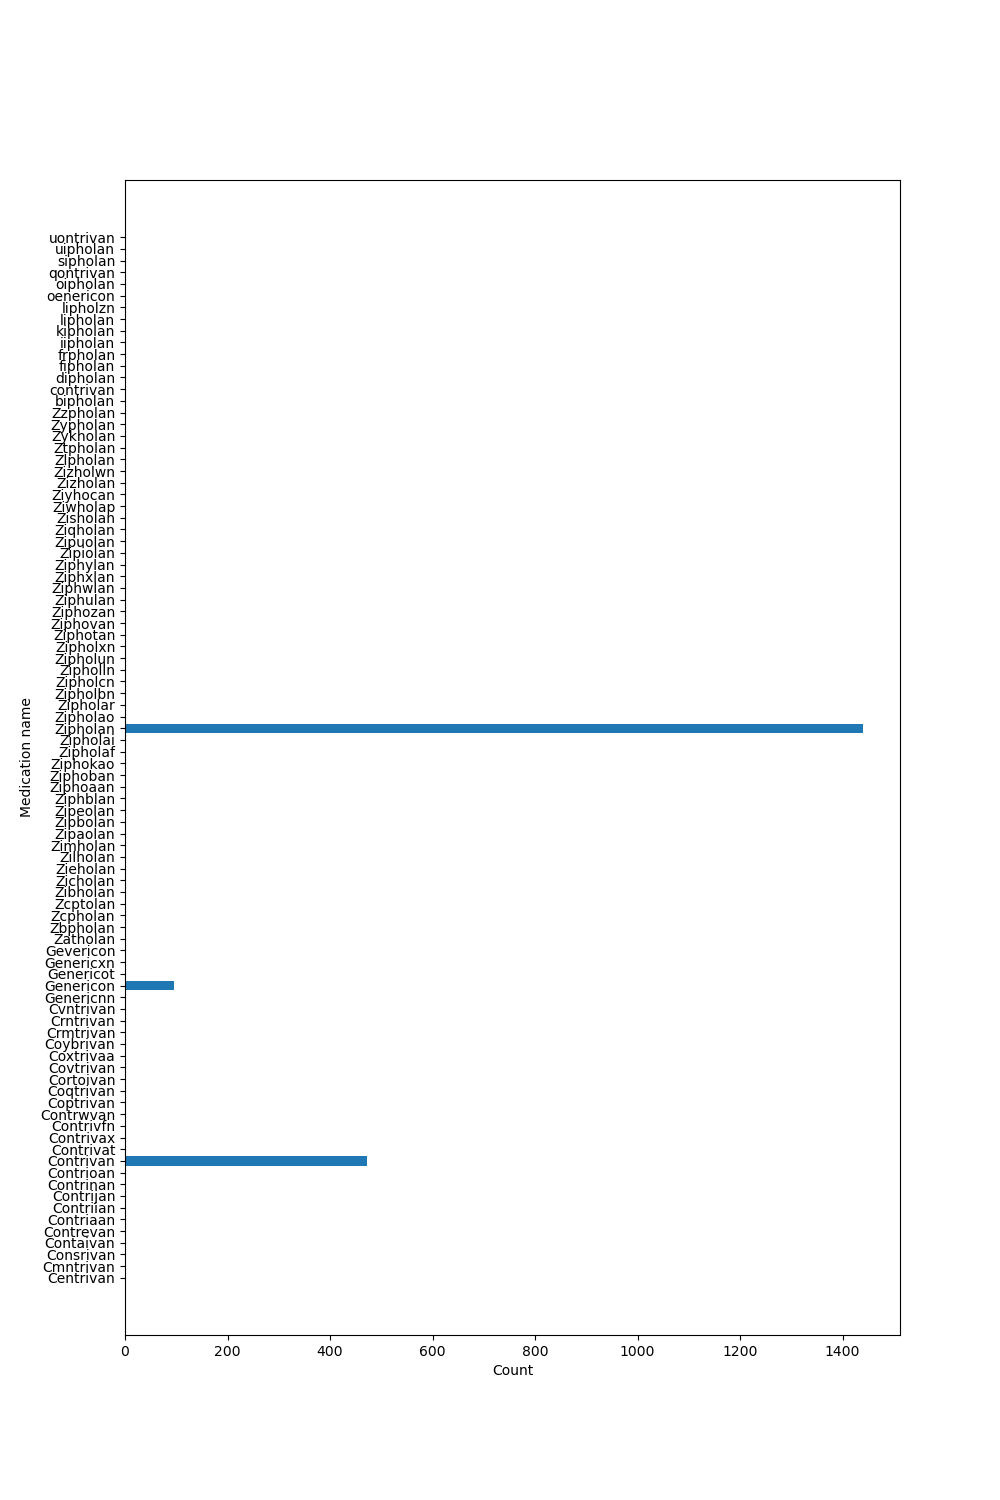
We clearly see the structure of the data: the three original medications (“Contrivan”, “Genericon” and “Zipholan”) are the most common ones, but there are many spelling mistakes or slight variations of the original names.
The idea behind deduplicate() is to use the fact that
the string distance of misspelled medications will be
closest to their original (most frequent) medication name
- and therefore form clusters.
Deduplication: suggest corrections of misspelled names#
The deduplicate() function uses clustering based on
string similarities to group duplicated names.
Let’s deduplicate our data:
from skrub import deduplicate

deduplicated_data = deduplicate(duplicated_names)

deduplicated_data[:5]
Contrivan    Contrivan
Cvntrivan    Contrivan
Contrivan    Contrivan
Coqtrivan    Contrivan
Contriian    Contrivan
dtype: object
And that’s it! We now have the deduplicated data.
We can visualize the distribution of categories in the deduplicated data:
deduplicated_unique_examples, deduplicated_counts = np.unique(
    deduplicated_data, return_counts=True
)
deduplicated_series = pd.Series(deduplicated_counts, index=deduplicated_unique_examples)

plt.figure(figsize=(10, 5))
plt.barh(deduplicated_unique_examples, deduplicated_counts)
plt.xlabel("Count")
plt.ylabel("Medication name")
plt.show()
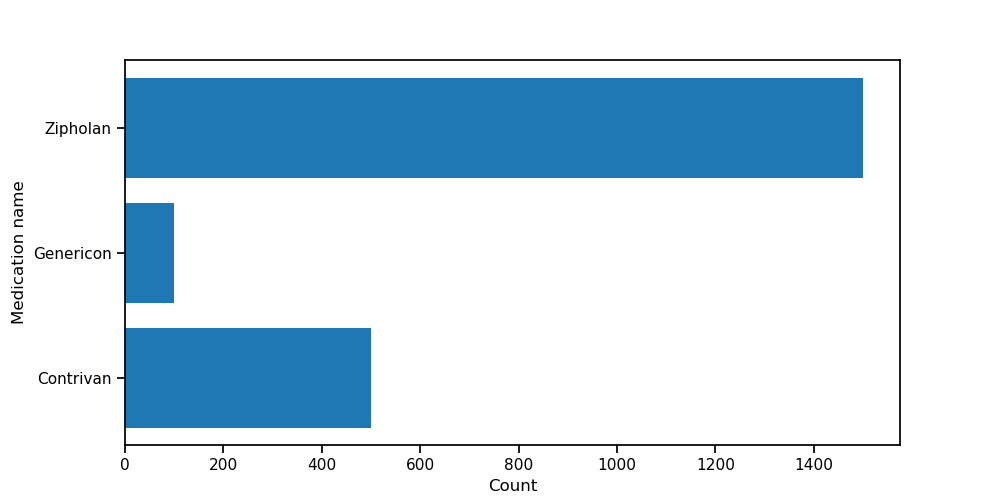
Here, the silhouette score finds the ideal number of clusters (3) and groups the spelling mistakes.
In practice, the translation/deduplication will often be imperfect
and require some tweaks.
In this case, we can construct and update a translation table based on the
data returned by deduplicate().
# create a table that maps original to corrected categories
translation_table = pd.Series(deduplicated_data, index=duplicated_names)

# remove duplicates in the original data
translation_table = translation_table[~translation_table.index.duplicated(keep="first")]

translation_table.head()
Contrivan    Contrivan
Cvntrivan    Contrivan
Coqtrivan    Contrivan
Contriian    Contrivan
Contaivan    Contrivan
dtype: object
In this table, we have the category name on the left, and the cluster it was translated to on the right. If we want to adapt the translation table, we can modify it manually.
Visualizing string pair-wise distance between names#
Below, we use a heatmap to visualize the pairwise-distance between medication names. A darker color means that two medication names are closer together (i.e. more similar), a lighter color means a larger distance.
from skrub import compute_ngram_distance
from scipy.spatial.distance import squareform

ngram_distances = compute_ngram_distance(unique_examples)
square_distances = squareform(ngram_distances)

import seaborn as sns

fig, ax = plt.subplots(figsize=(14, 12))
sns.heatmap(
    square_distances, yticklabels=unique_examples, xticklabels=unique_examples, ax=ax
)
plt.show()
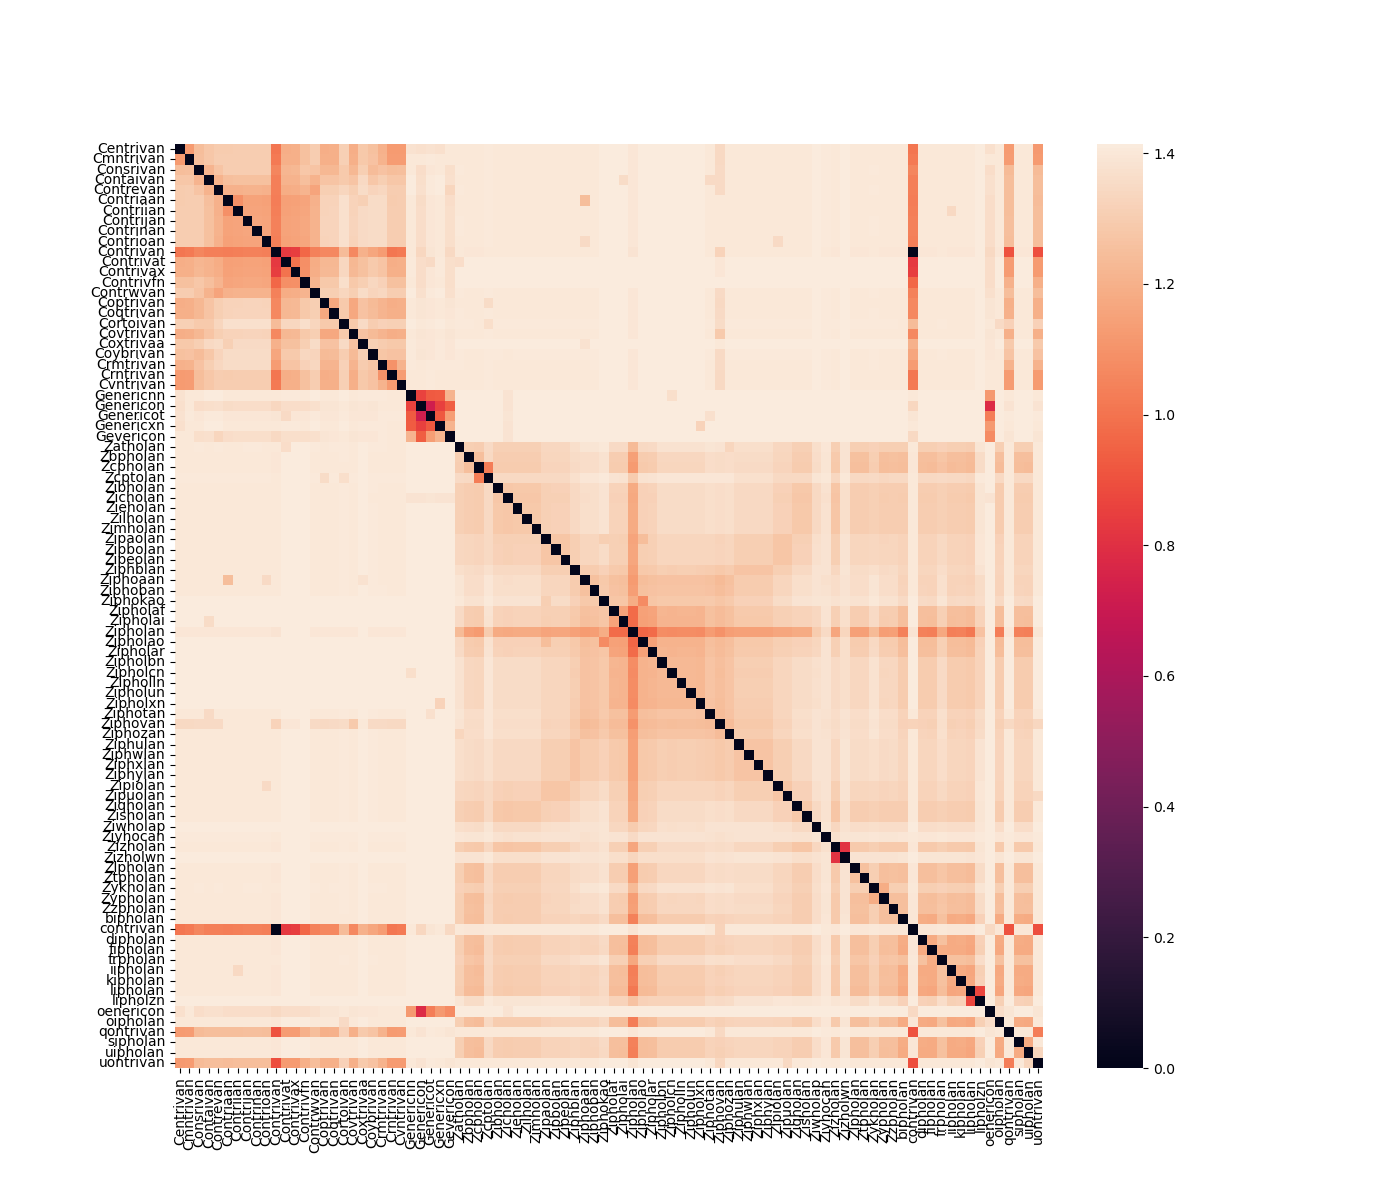
We have three clusters appearing - the original medication names and their misspellings that form a cluster around them.
Conclusion#
In this example, we have seen how to use the deduplicate() function to
automatically detect and correct misspelled category names.
Note that deduplication is especially useful when we either
know our ground truth (e.g. the original medication names),
or when the similarity across strings does not
carry useful information for our machine learning task.
Otherwise, we prefer using encoding methods such as GapEncoder
or MinHashEncoder.
Total running time of the script: (0 minutes 6.062 seconds)