from helpers import (
    generate_data_with_outliers,
    plot_feature_with_outliers
)

values = generate_data_with_outliers()

plot_feature_with_outliers(values)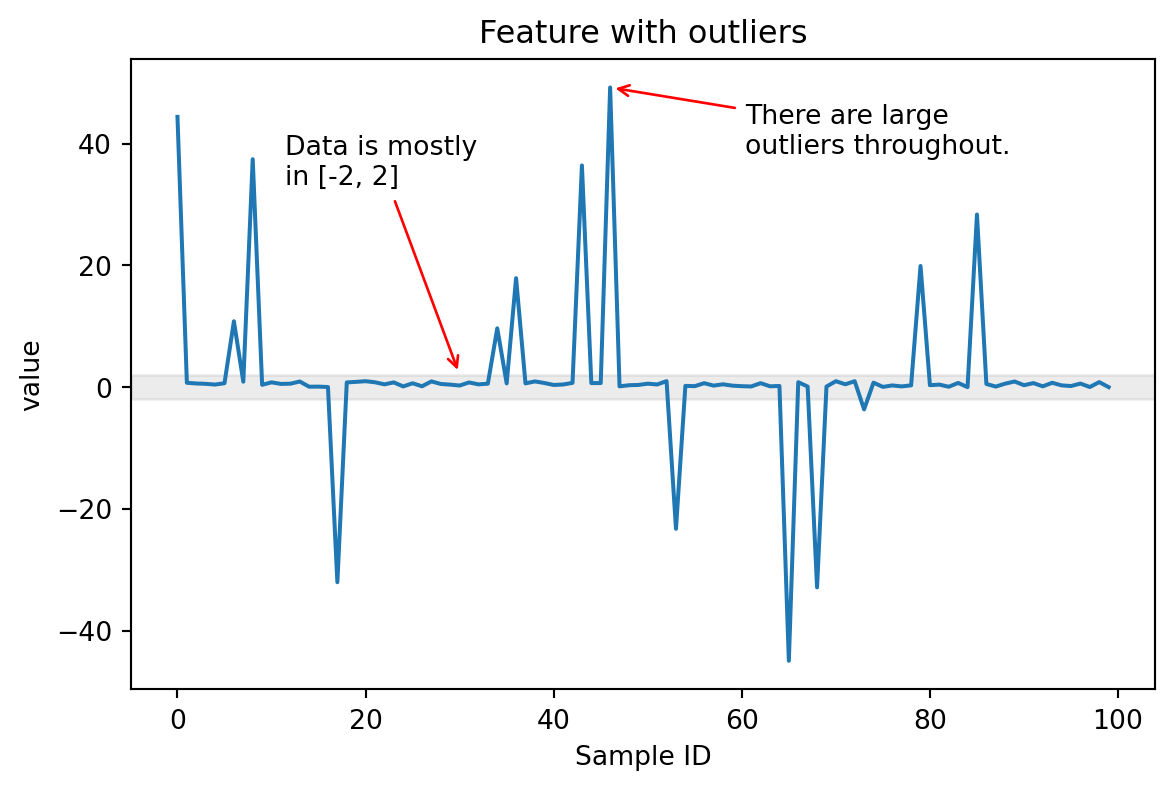
Now that we can transform any column we want thanks to ApplyToCols, ApplyToFrame and the selectors, we can start covering the feature engineering part of our pipeline, beginning from numerical features.
Specifically, we will find out how to safely scale numerical features with the skrub SquashingScaler.
When dealing with numerical features that contain outliers (including infinite values), standard scaling methods can be problematic. Outliers can dramatically affect the centering and scaling of the entire dataset, causing the scaled inliers to be compressed into a narrow range.
Consider this example:
from helpers import (
generate_data_with_outliers,
plot_feature_with_outliers
)
values = generate_data_with_outliers()
plot_feature_with_outliers(values)
In this case, most of the values are in the range [-2, 2], but there are some large outliers in the range [-40, 40] that can cause issues when the feature needs to be scaled.
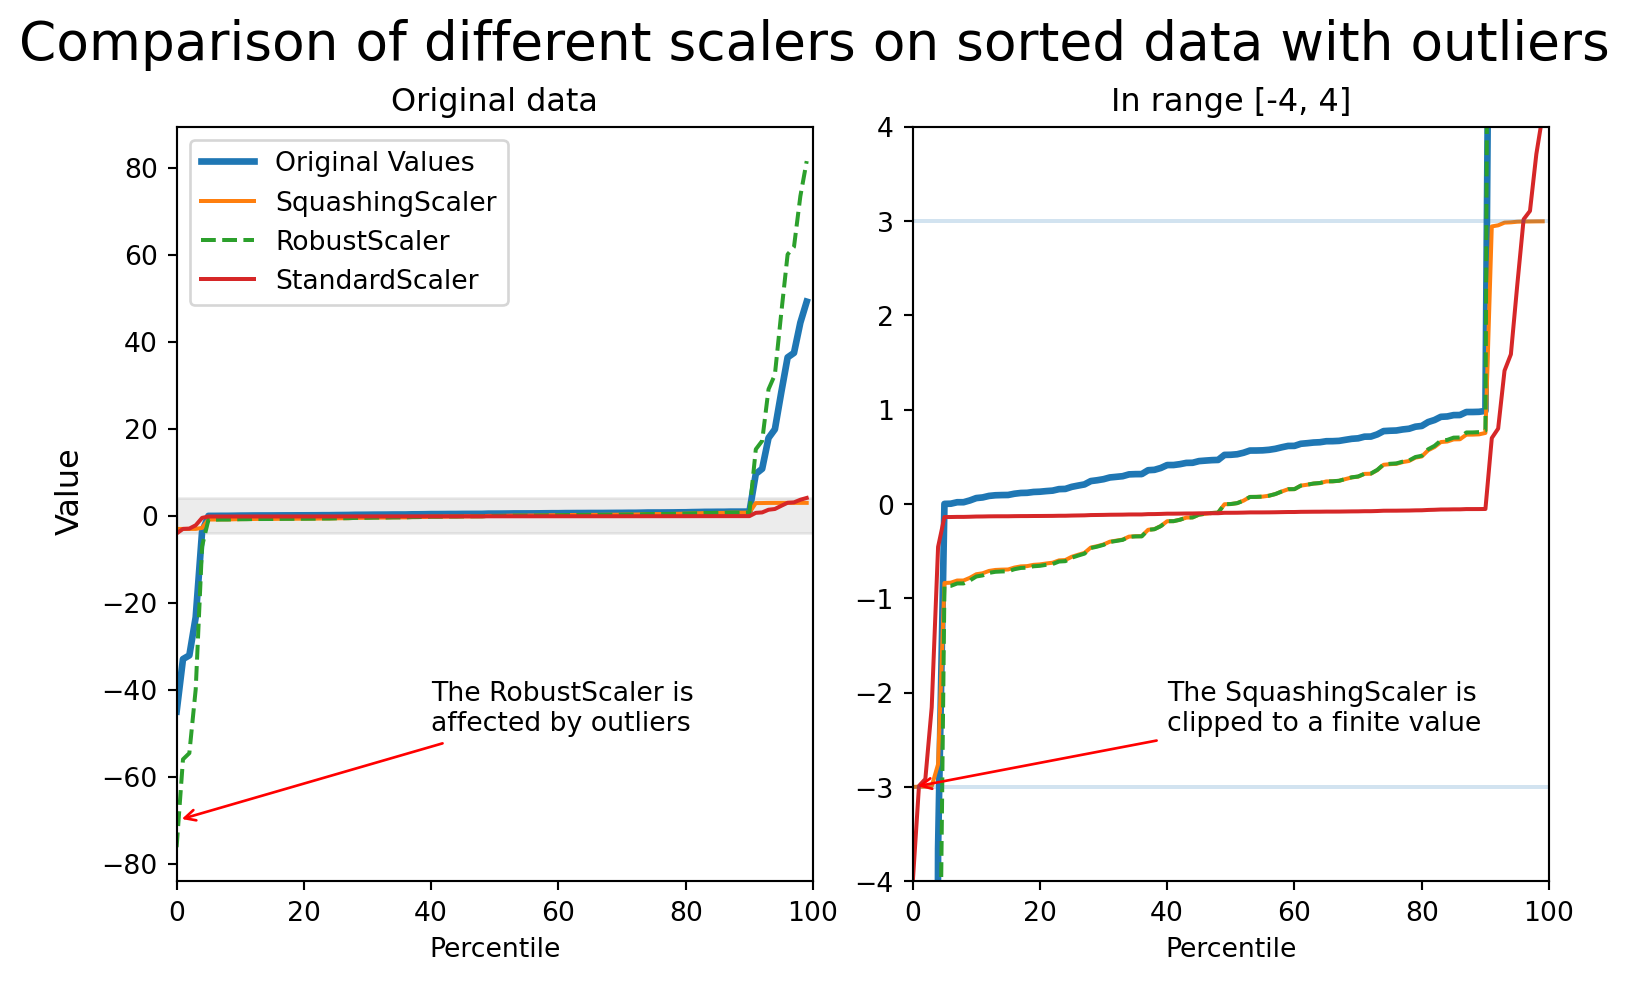
The StandardScaler computes mean and standard deviation across all values. With outliers present, these statistics become unreliable, and the scaling factor can become too small, squashing inlier values.
The RobustScaler uses quantiles (typically the 25th and 75th percentiles) instead of mean/std, which makes it more resistant to outliers. However, it doesn’t bound the output values, so extreme outliers can still have very large scaled values.
The SquashingScaler combines robust centering with smooth clipping to handle outliers effectively.
It works as following:
SquashingScalerThe SquashingScaler has various advantages over traditional scalers:
StandardScaler.A disadvantage of the SquashingScaler is that it is non-invertible: The soft clipping function is smooth but cannot be exactly inverted.
When compared on data with outliers:
If we plot the impact of each scaler on the result, this is what we can see:
from helpers import scale_feature_and_plot
scale_feature_and_plot(values)